- The U.S. negative equity rate fell to 17 percent of all homeowners with a mortgage in the second quarter, representing 8.7 million homeowners. Negative equity is expected to fall to 14.9 percent by the second quarter of 2015.
- The “effective” negative equity rate, including those homeowners with 20 percent or less equity in their homes, is 34.8 percent.
Introduction
According to the second quarter Zillow Negative Equity Report, the national negative equity rate continued to decline in Q2 2014, falling to 17 percent, down 14.4 percentage points from its peak (31.4 percent) in the first quarter of 2012. Negative equity has fallen for nine consecutive quarters as home values have risen. However, more than 8.7 million homeowners with a mortgage still remain underwater (Figure 1).
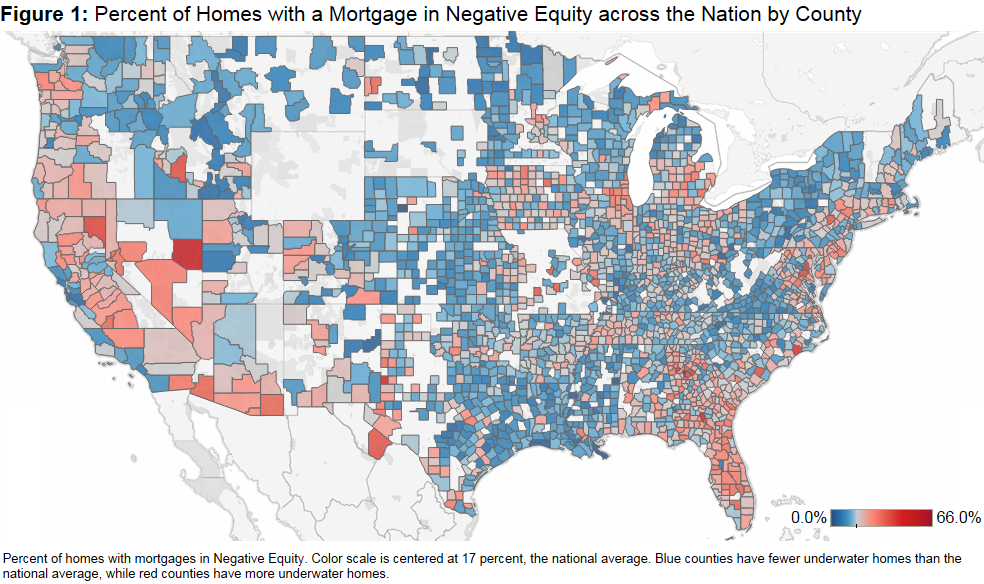
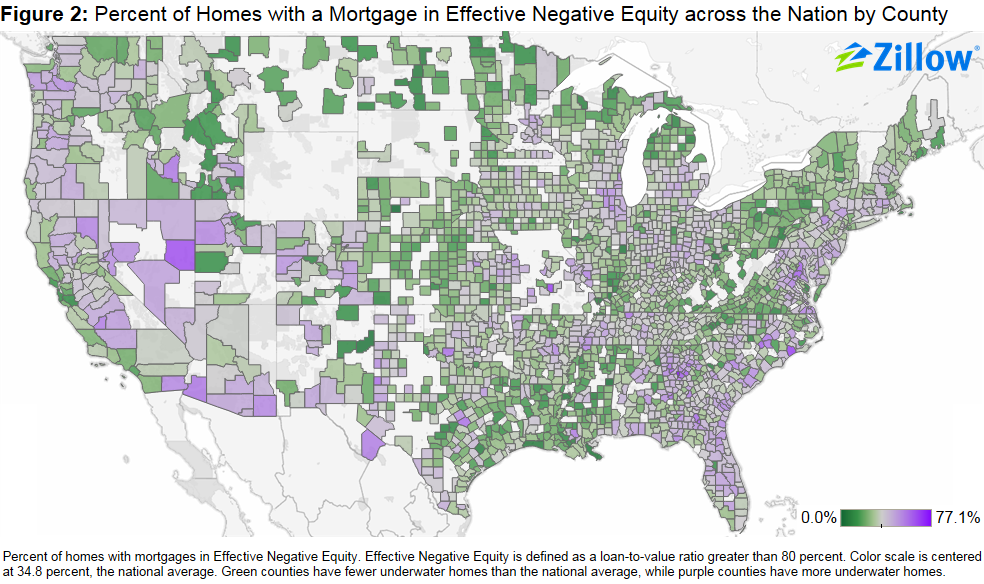
Moreover, the effective U.S. negative equity rate — where the loan-to-value ratio is more than 80 percent, making it difficult for a homeowner to afford the down payment on another home — remains stubbornly high, at 34.8 percent of homeowners with a mortgage. While not all of these homeowners are underwater, they have relatively little equity in their homes, and therefore selling and buying a new home while covering all of the associated costs (real estate agent fees, closing costs and a new down payment) would be difficult (Figure 2). Among all homeowners, 11.9 percent are underwater – roughly one-third of homeowners do not have a mortgage and own their homes free and clear.
Differences by Demographic Generation and Price Tiers
Approximately 18.7 percent of Generation X homeowners (those aged from 35 to 49) are underwater on their mortgage, compared to 10.9 percent of Baby Boomers (50 to 64 years old) and 19.6 percent of Millennials (see Figure 7).
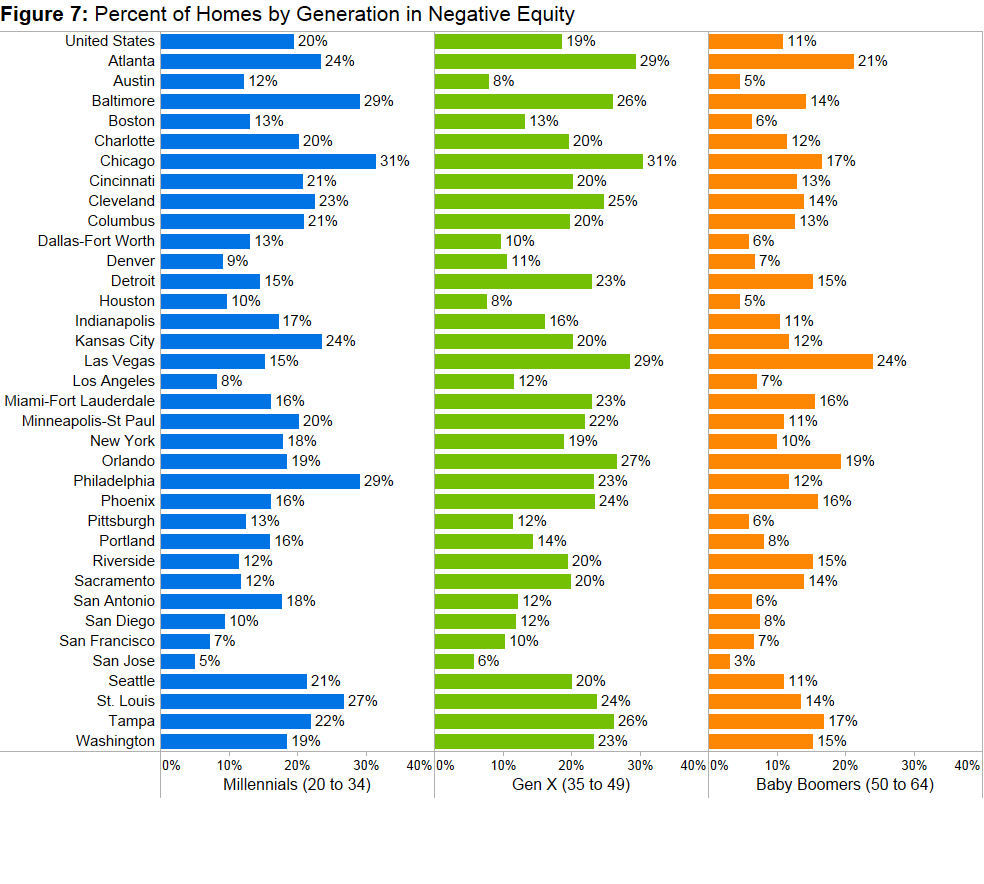 Figure 4 shows the share of homes by price tier in negative equity. Among all homes with a mortgage nationwide, 28.2 percent valued within the bottom third of home values were underwater in the second quarter, compared to 15.8 percent of homes in the middle tier and 9.2 percent in the top tier.
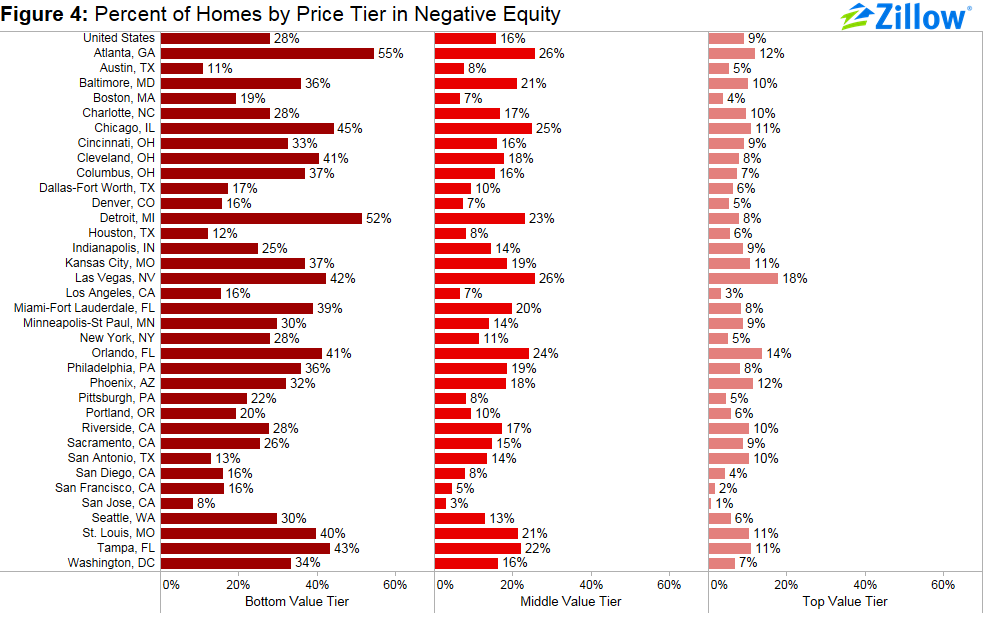
Because it is very difficult for an underwater homeowner to list their home for sale, the disparities in negative equity among generations and price tiers stand to have ripple effects throughout the housing market. Baby Boomers may not be able to find move-up buyers for their homes as Gen X remains stuck, and first-time homebuyers (many of whom are Millennials) will have more difficulty finding affordable starter homes because of high negative equity rates among the homes in the bottom one-third of home values in their market.
Inventory
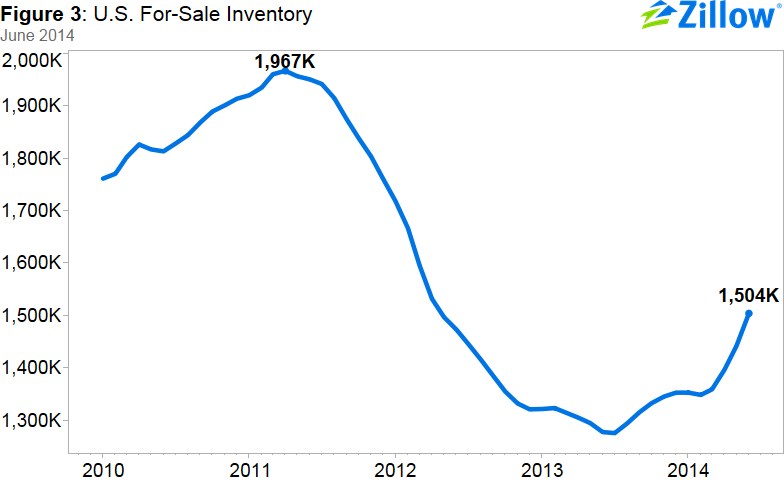
Mounting home value declines during the housing recession led to historically high levels of negative equity, which in turn severely restricted the available for-sale inventory in the marketplace. Figure 3 shows national for-sale inventory that has been seasonally adjusted and smoothed. While inventory levels are still depressed, inventory has been increasing over the last few months.
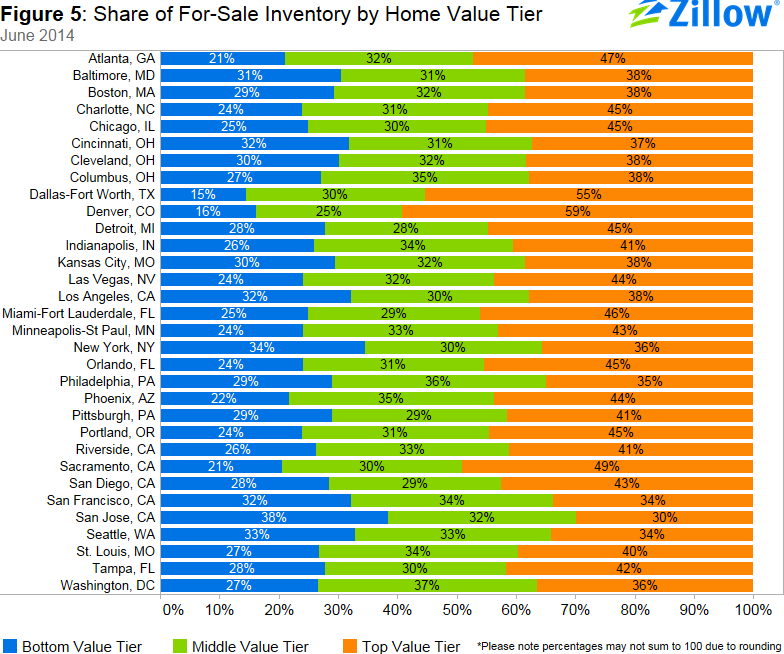
It remains difficult for underwater homeowners to list their home for sale without engaging in a short sale or bringing cash to the closing table. The fact that the bulk of negative equity has accumulated in the bottom one-third of homes by home value in most markets across the nation has led to especially tight inventory conditions among lower valued homes. Figure 5 shows the inventory levels across the different price tiers for June for the largest metros, showing the largest inventory shortages among the bottom tier.
Some metros that are experiencing very high home value appreciation rates are also seeing large declines in negative equity, including Atlanta (down 4.7 percentage points from the previous quarter) and Riverside (down 4.9 percentage points). But in general, negative equity levels still remain very high, and will be slow to dissipate as home value appreciation and foreclosure activity slows. Therefore, inventory will remain impacted for several years to come, and this will cause a ripple effect in the overall housing market. Furthermore, even if potential homebuyers are able to find a house they want and in theory can afford, many of them don’t have enough equity in their current home to make the move.
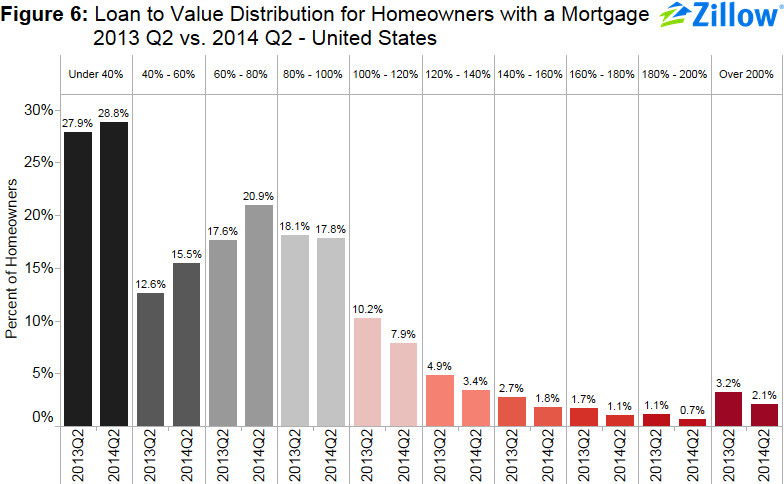
Figure 6 shows the loan-to-value (LTV) distribution for homeowners with a mortgage in Q2 2014 versus Q2 2013. The bulk of underwater homeowners, roughly 7.9 percent, are underwater by up to 20 percent of their loan value, and will soon cross over into positive equity territory. However they will still be effectively locked out of the resale market, as they will not gain enough of a profit from the sale of their current house to pay the expenses and down payment associated with buying a new home.
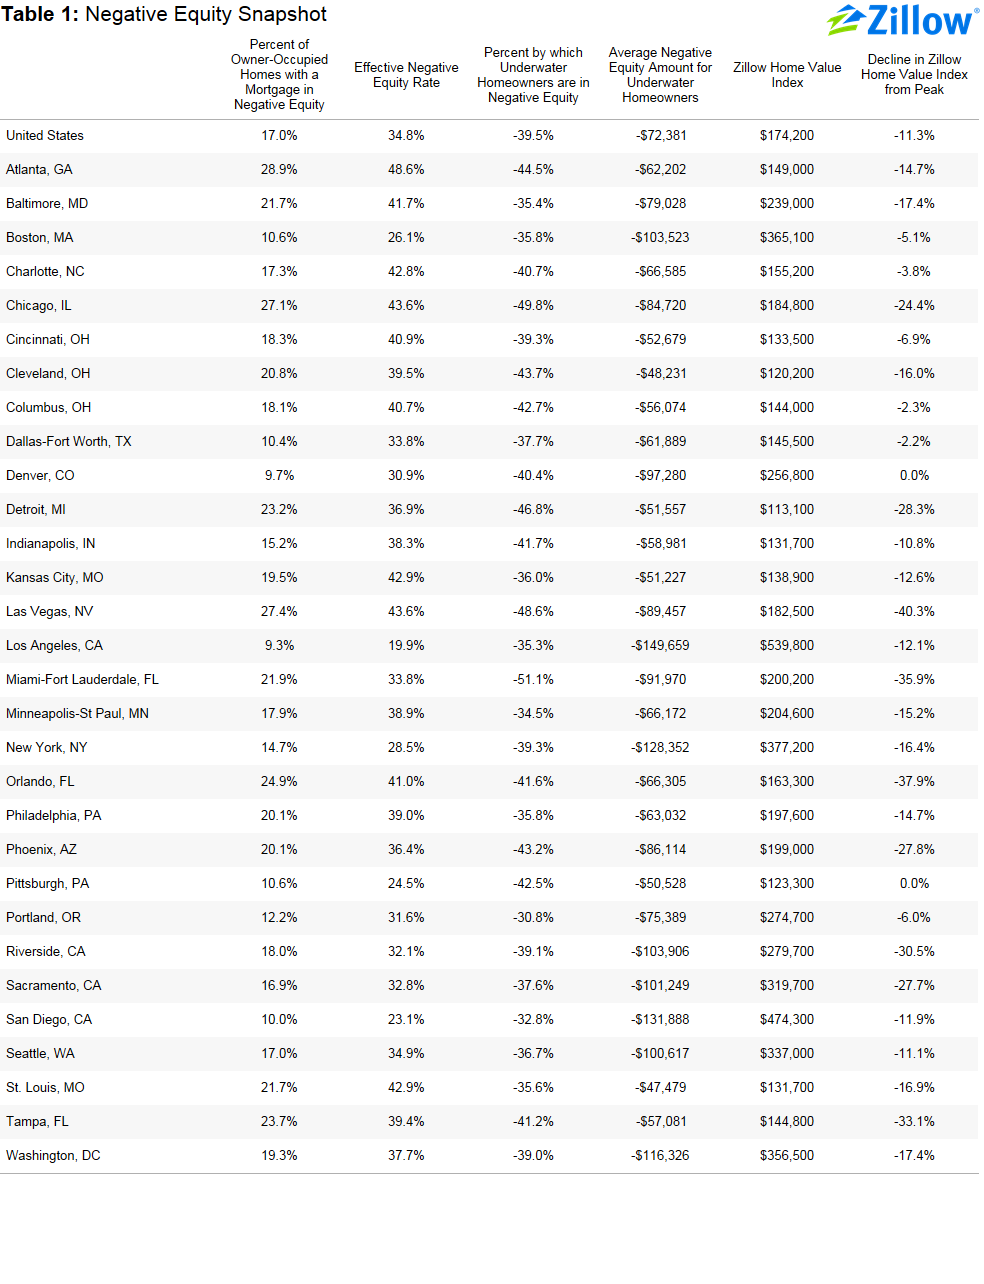
Nationally, the effective negative equity rate stands at 34.8 percent of all homeowners with a mortgage. Therefore, in a move-up market, homeowners with less than 20 percent equity will effectively still be “locked” out of the resale market. On average, a U.S. homeowner in negative equity owes $72,381 more than what their home is worth, or 39.5 percent more than the home’s value (Table 1). While roughly a fifth of homeowners with a mortgage are underwater, 93.1 percent of these homeowners are current on their mortgage payments.
Regional Trends
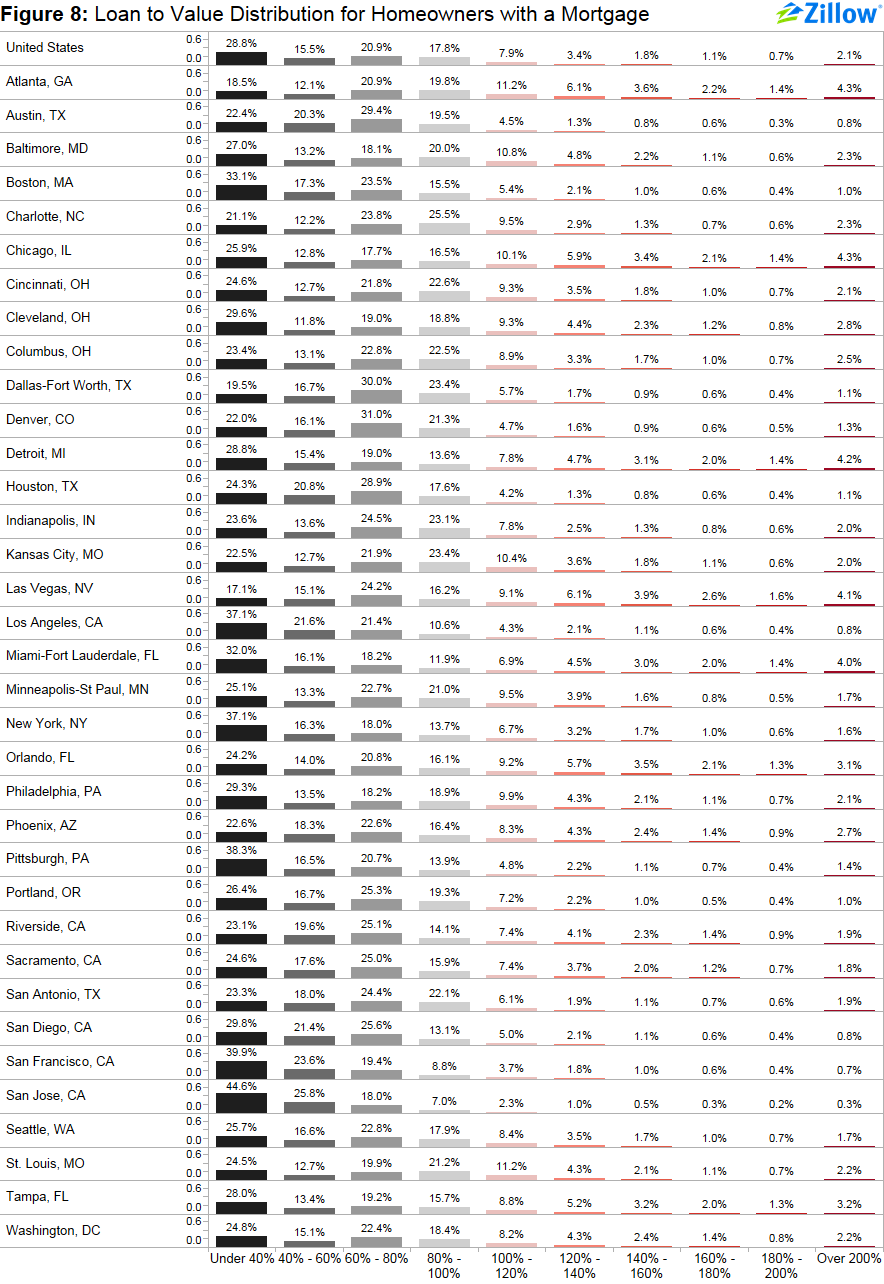
While the national negative equity rate is 17 percent, on the metro level there is wide variation in negative equity, with the percentage of underwater borrowers ranging from 1.7 percent to 43.6 percent. Furthermore, there is wide variation in how deeply homeowners are underwater. Figure 8 provides an overview of the distribution of the loan-to-value ratio for the largest metropolitan areas (a loan-to-value ratio greater than 100 percent means that the homeowner is underwater).
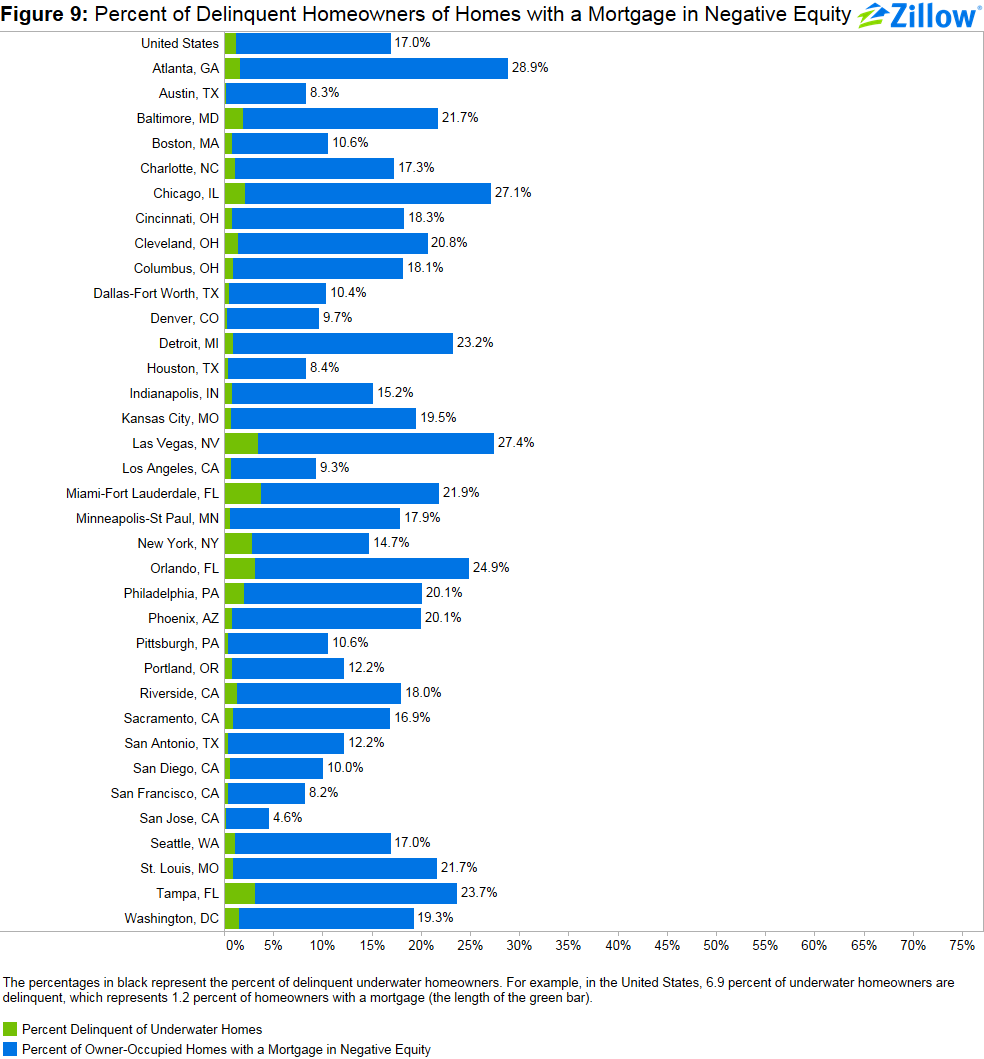
While negative equity makes a household more vulnerable to foreclosure, most homeowners in negative equity will not end up in default. The majority of underwater homeowners continue to make regular payments on their mortgages, with only 6.9 percent of underwater homeowners being delinquent. This implies that 1.2 percent of all homeowners with a mortgage are at high risk for foreclosure near-term. Figure 9 shows a breakdown of these numbers for the top 35 metros.
Forecast
The Zillow Negative Equity Forecast predicts the negative equity rate among all homeowners with a mortgage will fall to at least 14.9 percent by Q2 2015.
Outlook
High levels of negative equity will remain a drag on the housing market for years to come. They not only distort inventory levels, especially on the bottom end of the market, but also cause a ripple effect for first time homebuyers, through move-up buyers and high-end homebuyers. In our analysis of age groups, we found that 19.6 percent of Millennial homeowners with a mortgage are underwater, compared to 18.7 percent of Generation X homeowners and 10.9 percent of Baby Boomer homeowners. Our home value forecast calls for 4.2 percent appreciation from June 2014 to June 2015. Given this forecast, we expect that negative equity rates will continue to decrease in the next year to a rate of, at most, 14.9 percent by Q2 2015.
Methodology
The Zillow Negative Equity Report incorporates mortgage data from TransUnion, a global leader in credit and information management, to calculate various statistics. The report includes, but is not limited to, negative equity, loan-to-value ratios and delinquency rates. To calculate negative equity, the estimated value of a home is matched to all outstanding mortgage debt and lines of credit associated with the home, including home equity lines of credit and home equity loans. All personally identifying information (“PII”) is removed from the data by TransUnion before delivery to Zillow. Overall, this report covers more than 870 metros, 2,400 counties and 23,000 ZIP codes across the nation.
The Zillow Negative Equity Forecast is a conservative estimate of what negative equity rates will be a year from now. To forecast negative equity, we take the current home value of a house and appreciate it by the Zillow Home Value Forecast (ZHVF) for the MSA in which the home is located. In cases where there is no ZHVF available, we use the historical rate of home appreciation, and for metros that don’t have a historical rate of appreciation we use the historical rate of inflation at the national level. For homes that are not located in a metropolitan area, we use the forecasted national rate of appreciation. To calculate the level of home equity a year from now, we use the forecasted home value and the current outstanding debt balance, where we make no assumptions about a homeowner’s debt level a year from now. We also make no assumptions about foreclosure activity in the coming year. Therefore, this forecast is a very conservative one, as homeowners will likely continue to pay down their debt throughout the year, and homes will likely continue to be foreclosed on, and both of these factors will contribute to a lower negative equity rate. The Zillow Negative Equity Forecast can therefore be considered a higher bound estimate of negative equity.
Download Zillow Negative Equity 2014 Q2 Data
Note: This post has been corrected from an earlier version, reflecting more accurate generational data. We apologize for any inconvenience.
