Blue and Red Home Values
Home values in counties that voted for Hillary Clinton had a more exaggerated boom and bust than in those that voted for Donald Trump, and homes in counties that voted for Trump are generally more affordable, according to a Zillow analysis of county-level home values, negative equity and affordability.
- From the peak of the housing market in mid-2007 to the trough in mid-2012, home values in counties won by Hillary Clinton fell 28.9 percent, versus a 17.5 percent decline in counties won by Donald Trump.
- Counties won by Hillary Clinton also experienced a stronger recovery, rising 34.2 percent from the trough through the present, compared to 21.3 percent in counties won by Donald Trump.
- The typical mortgage in counties that voted for Hillary Clinton consumes about 14.8 percent of household income, compared to 11.6 percent in counties that voted for Donald Trump.
Home values in counties that voted for Hillary Clinton had a more exaggerated boom and bust than in those that voted for Donald Trump, and homes in counties that voted for Trump are generally more affordable, according to a Zillow analysis of county-level home values, negative equity and affordability.
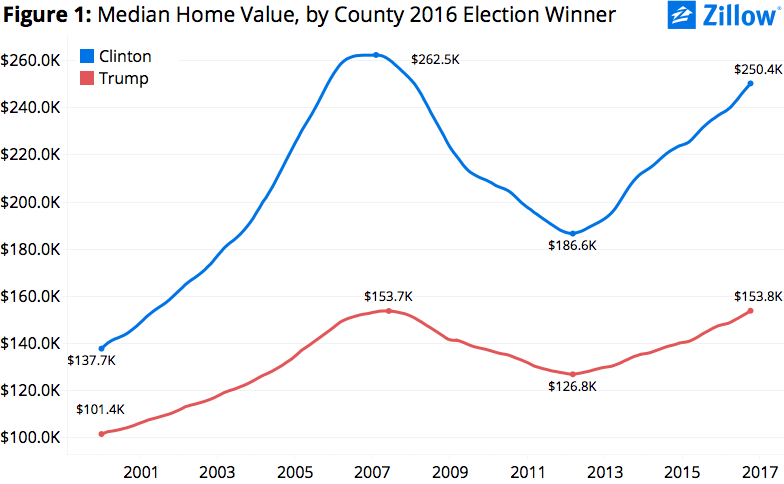
On average, homes are pricier in counties that voted for Hillary Clinton – a gap that has generally widened over the past two decades. But home values in counties that voted for Donald Trump in November experienced a less exaggerated housing boom and bust, and as a result, home values in these Trump counties are closer to their pre-crisis peak.
In January 2000, the median home value in counties that Hillary Clinton would go on to win a decade and a half later was $137,700, 36 percent (about $36,000) more than the $101,400 median home value in counties that Donald Trump would go on to win (figure 1).
 Overall, counties won by Hillary Clinton in 2016 had a more exaggerated boom and bust (figure 2). From the peak of the housing market in mid-2007 to the trough in mid-2012, home values in counties won by Hillary Clinton fell 28.9 percent versus a 17.5 percent decline in counties won by Donald Trump.
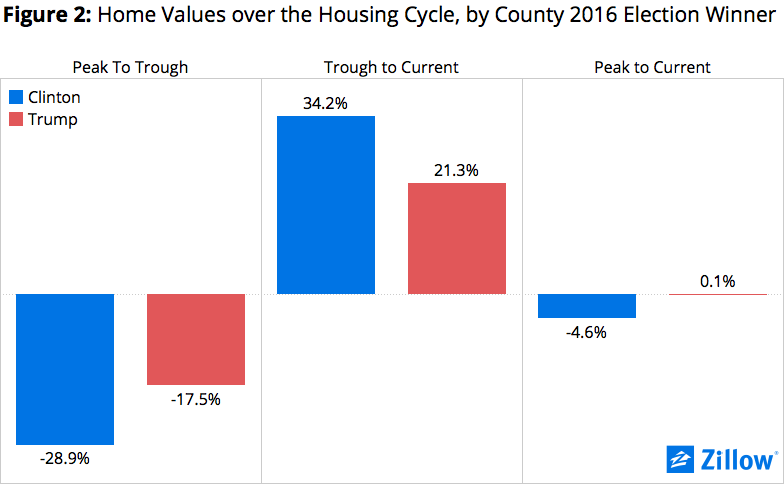 But counties won by Hillary Clinton also experienced a stronger recovery, rising 34.2 percent from the trough through the present, compared to a 21.3 percent increase since the trough in counties won by Donald Trump. Counties won by Hillary Clinton remain 4.6 percent below their pre-crisis peak while counties won by Donald Trump are now ever so slightly above their pre-crisis peak in median home values.
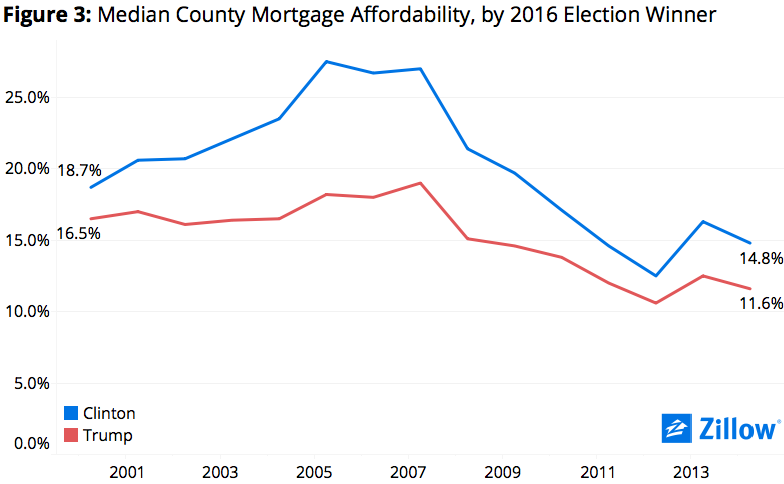
While home values are higher in Clinton counties, so are incomes. Still, mortgage affordability is better in Trump counties. The typical mortgage in counties that voted for Hillary Clinton consumes about 14.8 percent of household income, compared to 11.6 percent in counties that voted for Donald Trump (figure 3).[1]
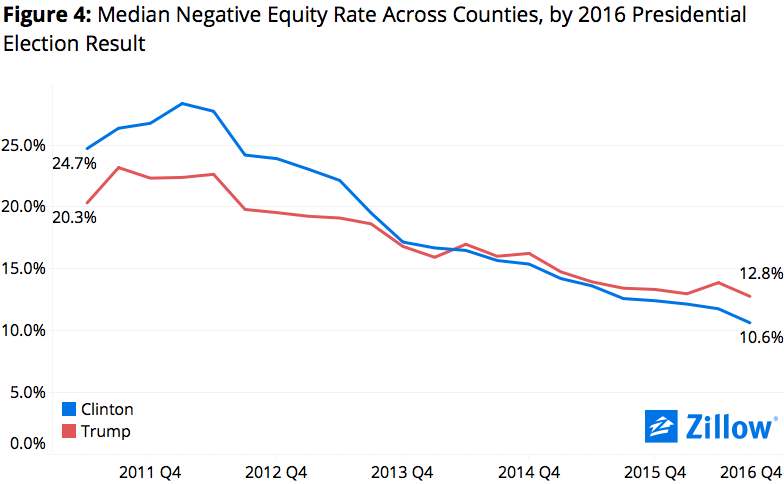
Due in part to the exaggerated boom and bust in many counties that voted for Hillary Clinton, negative equity tended to be higher in those counties just a few years ago (figure 4). However, the past three years have seen the rankings flip and negative equity is now slightly higher in counties that voted for Donald Trump.
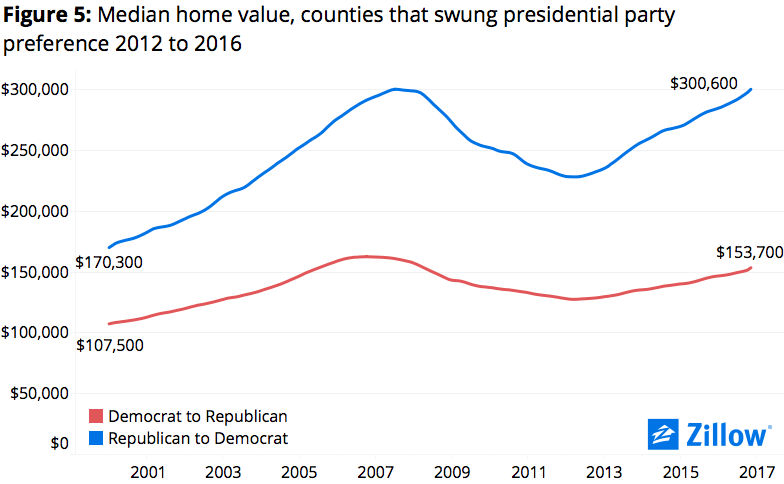
 Finally, we analyzed home values in counties that swung from one party to another between the 2012 and 2016 presidential elections. There were 223 counties nationwide that voted for Democrat Barack Obama in 2012 but swung to Republican Donald Trump in 2016 – the largest of which were Suffolk County (NY), Pinellas County (FL), and Macomb County (MI). There were 17 U.S. counties that voted for Republican Mitt Romney in 2012 but voted for Democrat Hillary Clinton in 2016 – the largest of which were Orange County (CA), Salt Lake County (UT) and Gwinnett County (GA).
Homes in counties that swung from Democrat to Republican remain 5.6 percent below their pre-crisis highs, but homes in counties that swung from Republican to Democrat are at their pre-crisis peak (figure 5).
[1] Note that this is a different version of our usual take on mortgage affordability. It uses IRS-reported taxpayer Adjusted Gross Income, AGI, to measure income. This version allows us to include more small and rural counties where survey-based measures of income are not available.

