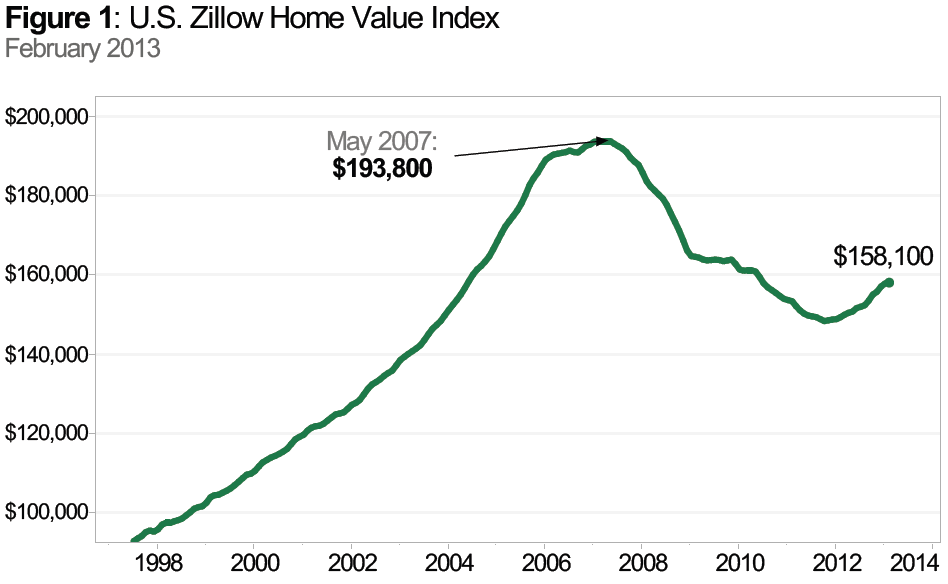
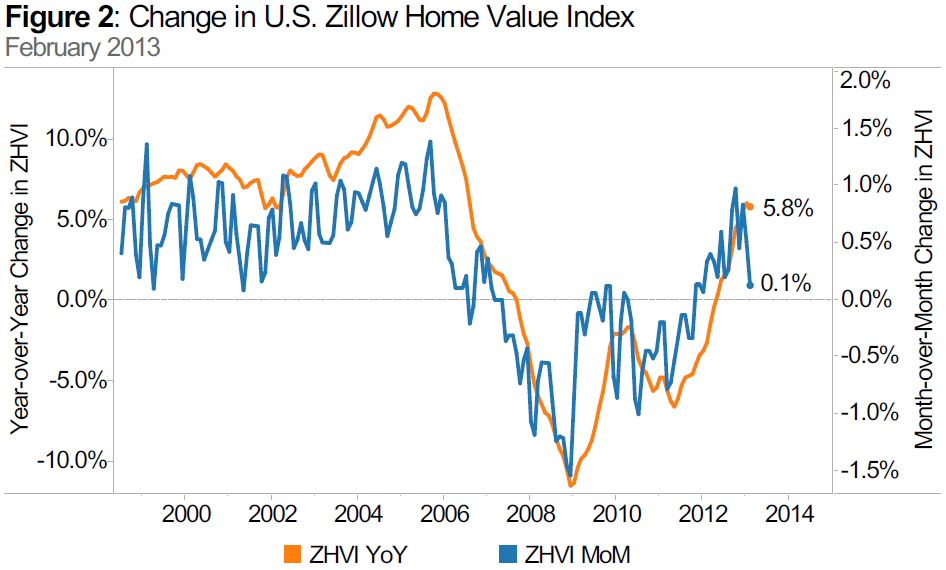
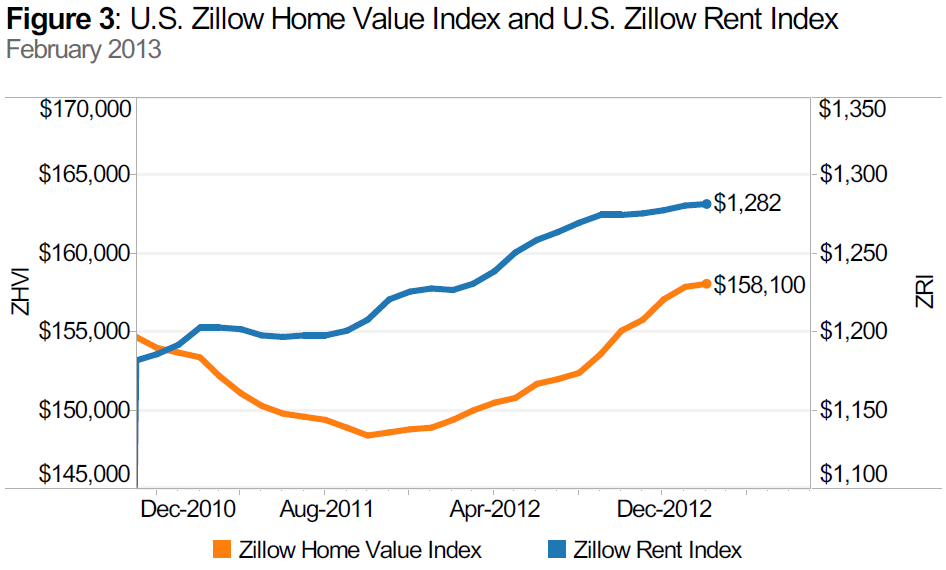
Zillow’s February Real Estate Market Reports, released today, show that national home values rose 0.1% from January to February to $158,100 (Figure 1). February 2013 marks the 16th consecutive month of home value appreciation. On a year-over-year basis, home values were up 5.8% (Figure 2) from February 2012. The 5.8% annual gain is the second-largest since August 2006, exceeded only by January’s 6% year-over-year jump. The last time national home values were at this level was in June 2004. Rents are up 4.5% on a year-over-year basis (Figure 3). The Zillow Home Value Forecast calls for 3.2% appreciation nationally from February 2013 to February 2014. Most markets have already hit a bottom – with only 9 out of 252 not projected to hit a bottom within the next year – and 79 out of the 252 markets covered are forecasted to experience home value appreciation of 3% or higher.
Home Values
The February Zillow Real Estate Market Reports cover 352 metropolitan and micropolitan areas. In February, 251 (71%) of the 352 markets showed monthly home value appreciation, and 276 (78%) of the 352 markets saw annual home value appreciation. Among the top 30 metros, all of them experienced monthly home value appreciation, as well as annual increases. Leading the pack in positive monthly appreciation were Detroit, Riverside, Phoenix and Las Vegas, which experienced 2.2%, 1.5%, 1.5% and 1.5% monthly home value appreciation, respectively. Overall, national home values were down 18.4% from their peak in May 2007 and up 6.5% from the post-recession trough in October 2011.
 Rents
Rents
The Zillow Rent Index (ZRI) covers 488 metropolitan and micropolitan areas and shows year-over-year gains for 329 metropolitan areas covered by the ZRI. The rental market remains strong (Figure 3), even as the housing market regains strength. Markets that saw extremely strong annual rent appreciation include Denver (8.5%), Charlotte (6.4%), Boston (6.1%) and San Francisco (5.9%). Investors continue to play a big role in the housing recovery, as they purchase homes (many times lower-priced homes or distressed inventory) and convert these into rental units to satisfy the increase in demand for rental housing. Many markets are seeing tight inventory in part brought on by active investors. Nationally, rents were up 4.5% in February on a year-over-year basis.
Foreclosures
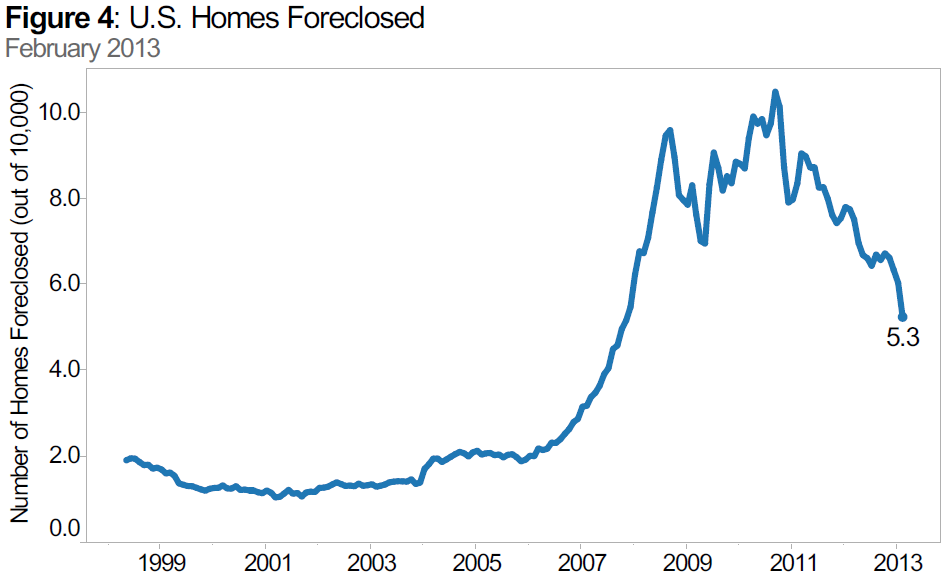
The rate of homes foreclosed continued to decline in February with 5.25 out of every 10,000 homes in the country being liquidated. Nationally, foreclosure re-sales also continued to fall, making up 13.7% of all sales in February (Figure 4). This is down 3.5 percentage points from February 2012 and down 6.2 percentage points from its peak level of 19.9% in March 2009.
Outlook
Most metropolitan areas have hit a bottom – 233 out of 252 metros – and more are projected to hit a bottom this year. 2013 continues to do well on the heels of 2012, however we expect home value appreciation to moderate throughout the year, especially in regions where appreciation has been particularly strong. The Zillow Home Value Forecast calls for 3.2% appreciation nationally from February 2013 to February 2014. Negative equity as of the end of 2012 stands at 27.5% nationally and is trending down as home values increase. In 2012, almost 2 million homeowners were freed from negative equity. Unfortunately, high levels of negative equity will remain with us for the next few years given the extent of home value declines in hard-hit markets such as Phoenix and Las Vegas. While we do expect some additional supply of homes on the market this year as new construction continues to ramp up and as many of those recently freed from negative equity choose to sell their homes, we expect demand to continue to outpace even this increase in supply, therefore leading to continued inventory shortages in some markets. In February, nationally housing inventory was 17% tighter than in February of last year, and this shortage in listing supply will continue to put upward pressure on home values on some regions.

