Asian and Pacific Islander-Headed Households Face Highest Housing Payment Burdens Among All Races

The Asian and Pacific Islander (API) community has long been harmed by the model minority myth that fails to consider the vast diversity of cultures, languages, national origins and individual experiences that make up this group. How many think about outcomes for the API community in the housing market is no different. With Asian households having the highest home values and highest incomes, many challenges can be easily glossed over since, on the surface, Asian households appear to be doing all right. But a closer look shows the story isn’t so clear. On average, API-headed households stretch their budgets to achieve homeownership more than other races, resulting in a higher share of monthly income going towards housing costs. What’s more, challenges regarding immigration and the current geopolitical climate add to the housing challenges faced by this group.
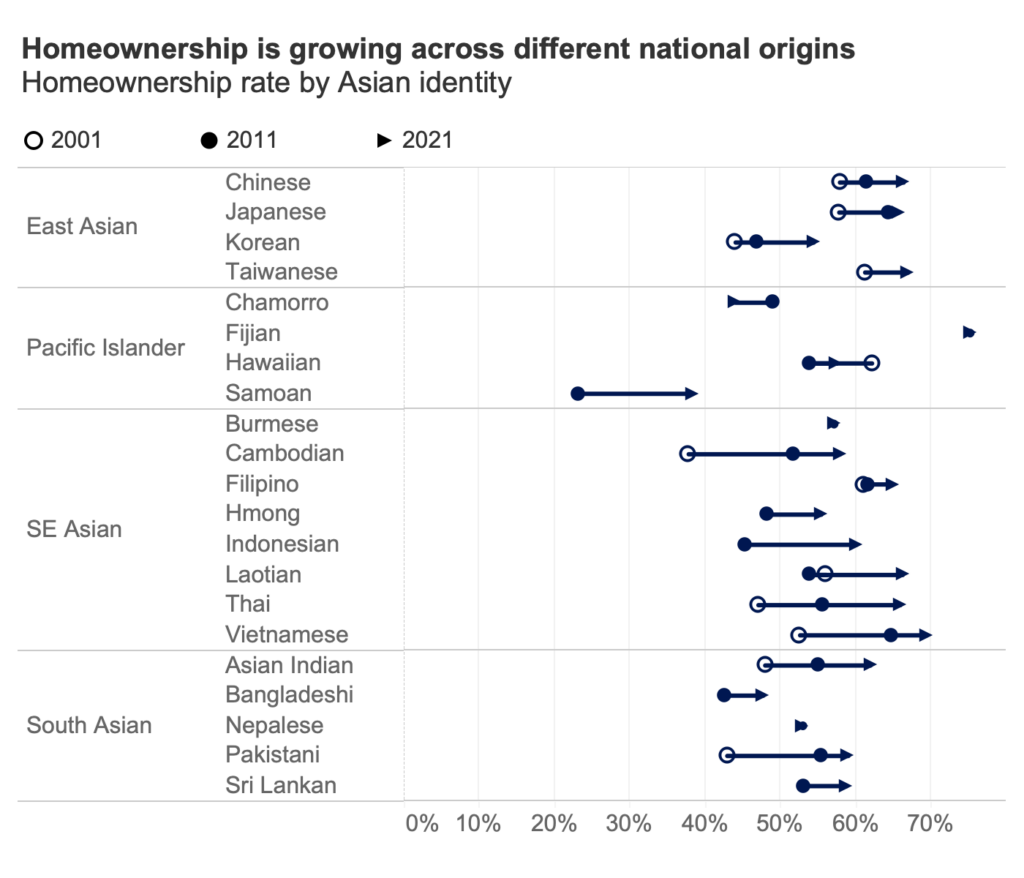
Of course, it’s important to note that the API community is a diverse landscape of several different national origins, and the gaps in homeownership and household income between different Asian populations is wide and growing. Homeownership rates across the national origins that create the API demographic range from under 40% to over 75%, and median household income ranges from just over $50,000 to $140,000, illustrating the vast array of experiences and challenges that are present.
However, zooming out and considering Asian- and Pacific Islander-headed households separately also illustrates some unique challenges that these groups face in the housing market. Pacific Islander-headed households have the lowest homeownership rate among all races across the lowest and highest income levels. And while Asian-headed households might have far higher homeownership rates across all income levels, Asian homeownership rates still lag behind the homeownership rate of white households, and achieving that high level of homeownership for Asian-headed households hasn’t come easily.
In the two decades between 2001 and 2021, more than three million Asian-headed households and roughly 50,000 Pacific Islander-headed households were added to the U.S. Over 80% of Asian-headed households and about a quarter of Pacific Islander-headed households are immigrant households who came to the United States already facing significant barriers that come with moving to a new country. These challenges, combined with affordability constraints and other housing-related challenges, particularly in high cost markets, meant that achieving and maintaining homeownership likely became even more challenging for these groups.

It is true that Asian-headed households tend to have higher-than-average incomes. The median household income for Asian-headed homes in 2021 was $99,000, compared to the national median of $67,900. And the median Asian-headed household income was higher than the overall median in all metro areas that had a large enough Asian population for data to be present in 2021. Higher income levels likely play a role in the overall lower level of denials that Asian mortgage applicants face, with a denial rate of only 7.5% compared to 11.1% for applicants overall and a 13.1% denial rate for Pacific Islander applicants — whose median incomes stand at just over $70,000.
But despite higher income levels on the surface and a lower mortgage denial rate for Asian mortgage applicants, many Asian- and Pacific Islander-headed households are stretched thin to achieve the American dream. The top reason why Asian and Pacific Islander mortgage applicants were denied a mortgage [1] was due to a debt-to-income (DTI) ratio that was deemed to be too high. Forty-one percent of Asian applicants and 39.2% of Pacific Islander applicants who were denied a mortgage were denied based on their DTI ratio. Furthermore, Asian and Pacific Islander mortgage applicants had a higher share of denials attributed to having insufficient cash to close than other races, and Asian applicants who were denied were more likely to be denied based on collateral than other races — other indicators that budgets for Asian and Pacific Islander households are stretched thin to reach for homeownership. While Asian mortgage applicants don’t face the same barriers in accessing credit as Black and Hispanic applicants, Pacific Islander applicants do with almost a quarter of mortgage denials being based on credit history.
While Asian and Pacific Islander homeowners are pushing their budgets to afford to get into a home, they are also pushing budgets to maintain homeownership. Asian and Pacific Islander households have the highest housing payment burdens of all races across all income levels, spending the largest share of household income on mortgage and rent payments. Despite the fact that Asian mortgage buyers have strong loan-to-value ratios (a median of 80% in the preliminary 2022 HMDA data, suggestive of a median 20% down payment), and received lower mortgage rates compared to other races in 2022 (4.6% for Asian applicants versus 5% for applicants overall). Pacific Islander mortgage buyers, however, have higher loan-to-value ratios (87.9% compared to 80% for mortgage buyers overall) and the same mortgage rates as mortgage buyers overall, 5%, contributing to even higher payment burdens than Asian households at lower income levels.
Asian and Pacific Islander households are more highly concentrated in the most expensive markets across the country, [2] leading to higher home values, on average. The typical value of homes purchased by Asian mortgage buyers was $575,000 in 2022 and $465,000 for Pacific Islander mortgage buyers, compared to $405,000 for mortgage buyers overall. Additionally, based on previous research on home values by race, Asian home values were about 4.2% above home values overall in the beginning of this year (although Pacific Islander home values were 4.2% below home values overall). These higher housing prices eat up a larger share of income, making it possible for housing cost burdens to be higher for Asian and Pacific Islander homeowners despite having higher incomes.
What’s more, certain recent geopolitical tensions have added to challenges that the Asian and Pacific Islander community faces in the housing market. Oftentimes, such tensions and policies aimed at larger institutions and governments bleed down to impact individuals and communities on the ground across the United States, and Asian and Pacific Islander communities often face the largest backlash. These impacts can open doors to more discrimination against the Asian and Pacific Islander population in housing and put additional layers on top of already large hurdles that these households must jump over to secure stable housing. Additionally, a handful of recent policies have been pursued to prevent foreign entities from purchasing property in the United States. The impacts, both intended and unintended, should be studied in the future to determine impacts to affordability and homeownership, especially for the API community. While building more homes to provide additional inventory to the market and utilizing policy and products to ease affordability constraints will be so important in opening access to homeownership in the United States, ensuring that all who live in this country have access to the American dream of homeownership is vital to cementing the progress we have made towards housing equity and keeping the door open to progress in the future.
[1] According to preliminary 2022 Home Mortgage Disclosure Act data pulled on May 15th, 2023.
[2] Pacific Islanders are also more highly concentrated in higher cost markets, but since this data is based on household heads, we don’t have enough data for any metro areas on Pacific Islander-headed households. One reason why is that Pacific Islander-headed households are more likely to experience multi-generational living, especially in Hawaii where a large portion of Pacific Islanders in the United States live. This puts more people under each household head, so when aggregated to the household level, there is a smaller sample of households to analyze.
