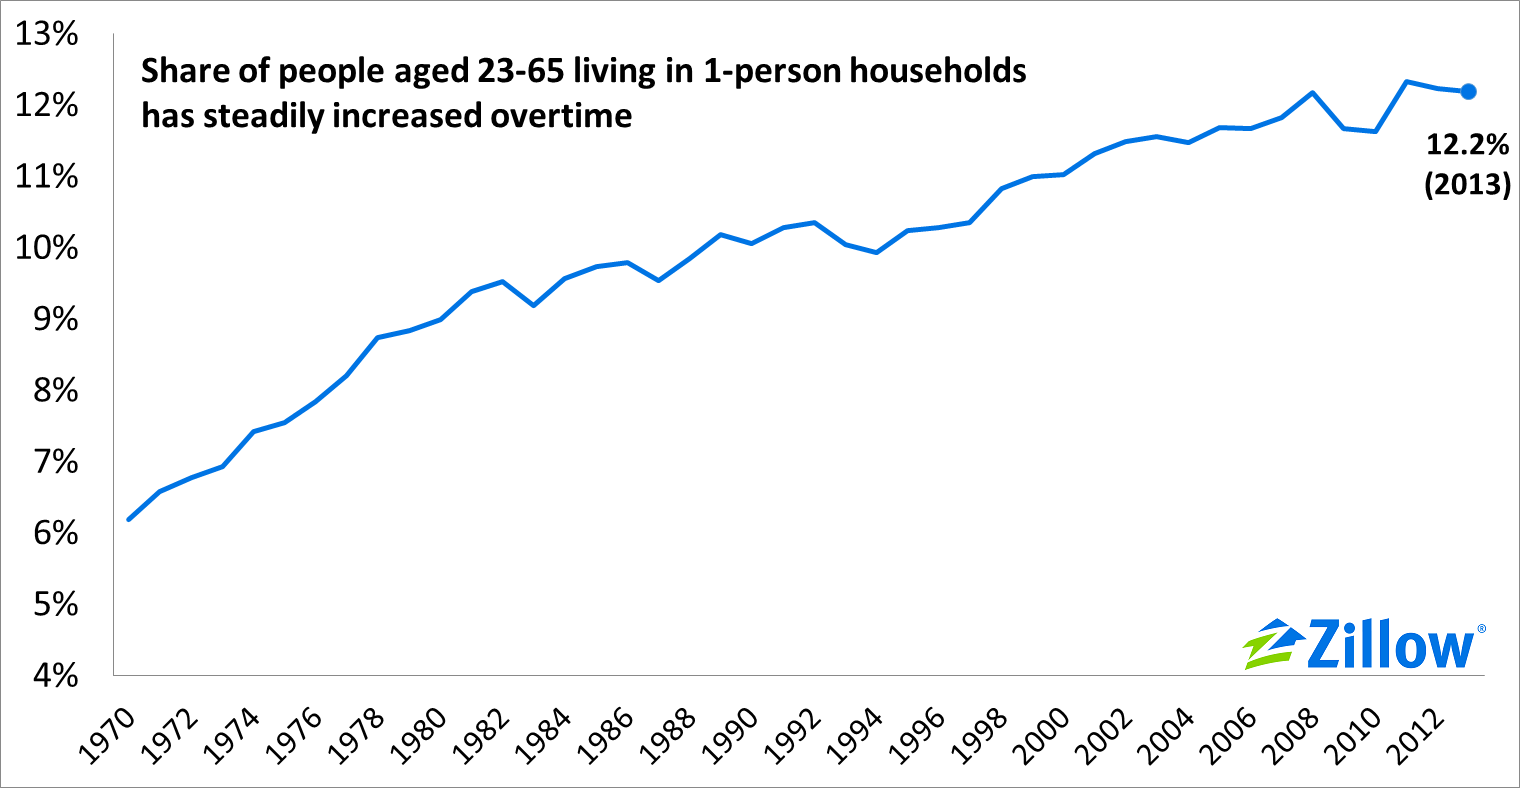
- The share of working-age adults, those 23 to 65 years old, living by themselves has steadily increased over time, reaching an all-time high of 12.3 percent in 2011.
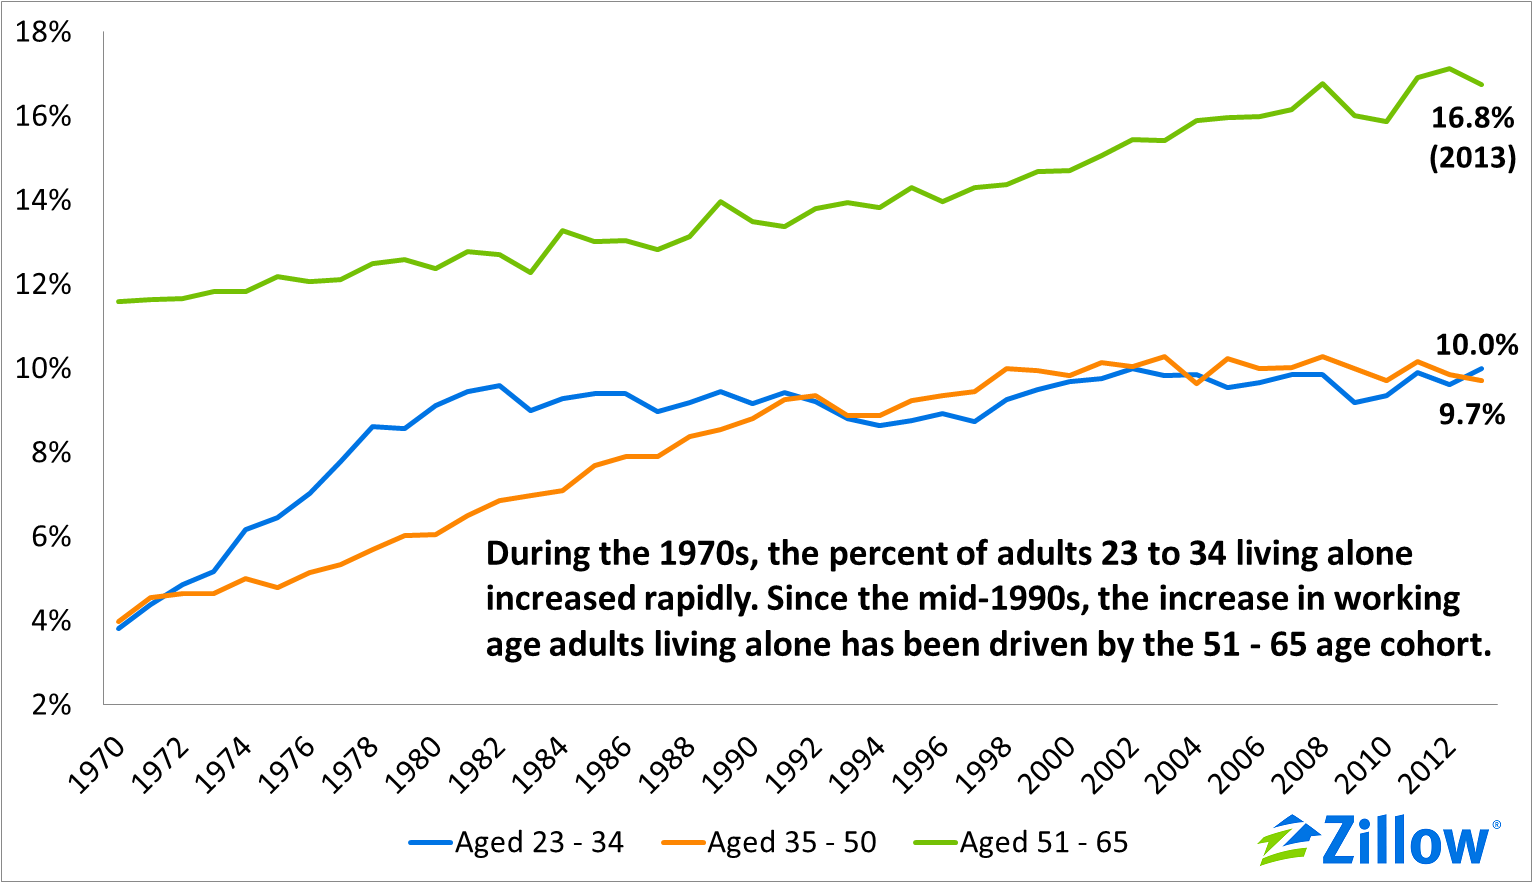
- Since the late nineties, growth in the share of working-age adults living alone has been driven by older adults aged 51 to 65.
- The share of younger adults aged 23 to 34 living alone has remained relatively constant since the early 1980s.
Doubled-up households—think young adults living in their parents’ basements, or people finding roommates to split costs in a tough economy—have been getting a lot of attention lately and have been blamed for lower-than-normal household formation rates. But what’s often overlooked is the almost uninterrupted rise in the share of adults living alone, and the age of those adults driving the trend.
The overall share of working-aged adults, those 23 to 65 years old, living in 1-person households has been steadily increasing for decades. It reached an all-time high of 12.3 percent in 2011 and stood at 12.2 percent in 2013.
This share grew quickly in the 1970s, mostly driven by younger adults aged 23 to 34. But beginning in 1980, the share of younger adults living alone plateaued, largely remaining just under 10 percent. The share of adults aged 35 to 50 living in 1-person households increased steadily until the late 1990s, when it also leveled out at around 10 percent. Since 2000, the increase in the share of working-age adults living alone has been driven by older adults, aged 51 to 65.
Several socioeconomic phenomena help explain these trends. The 1970s followed the free-love, feminist and anti-authoritarian movements of the late sixties. Young adults increasingly delayed marriage and childrearing. Women increasingly sought higher education and got better jobs as a result, allowing many to choose to live independently. At the same time, higher divorce rates and larger numbers of adults avoiding marriage altogether drove up the number of working-age adults living alone. By the 1990s, these dynamics appear to have leveled off for working age adults 50 and under. Older adults aged 51-65 are the exception.
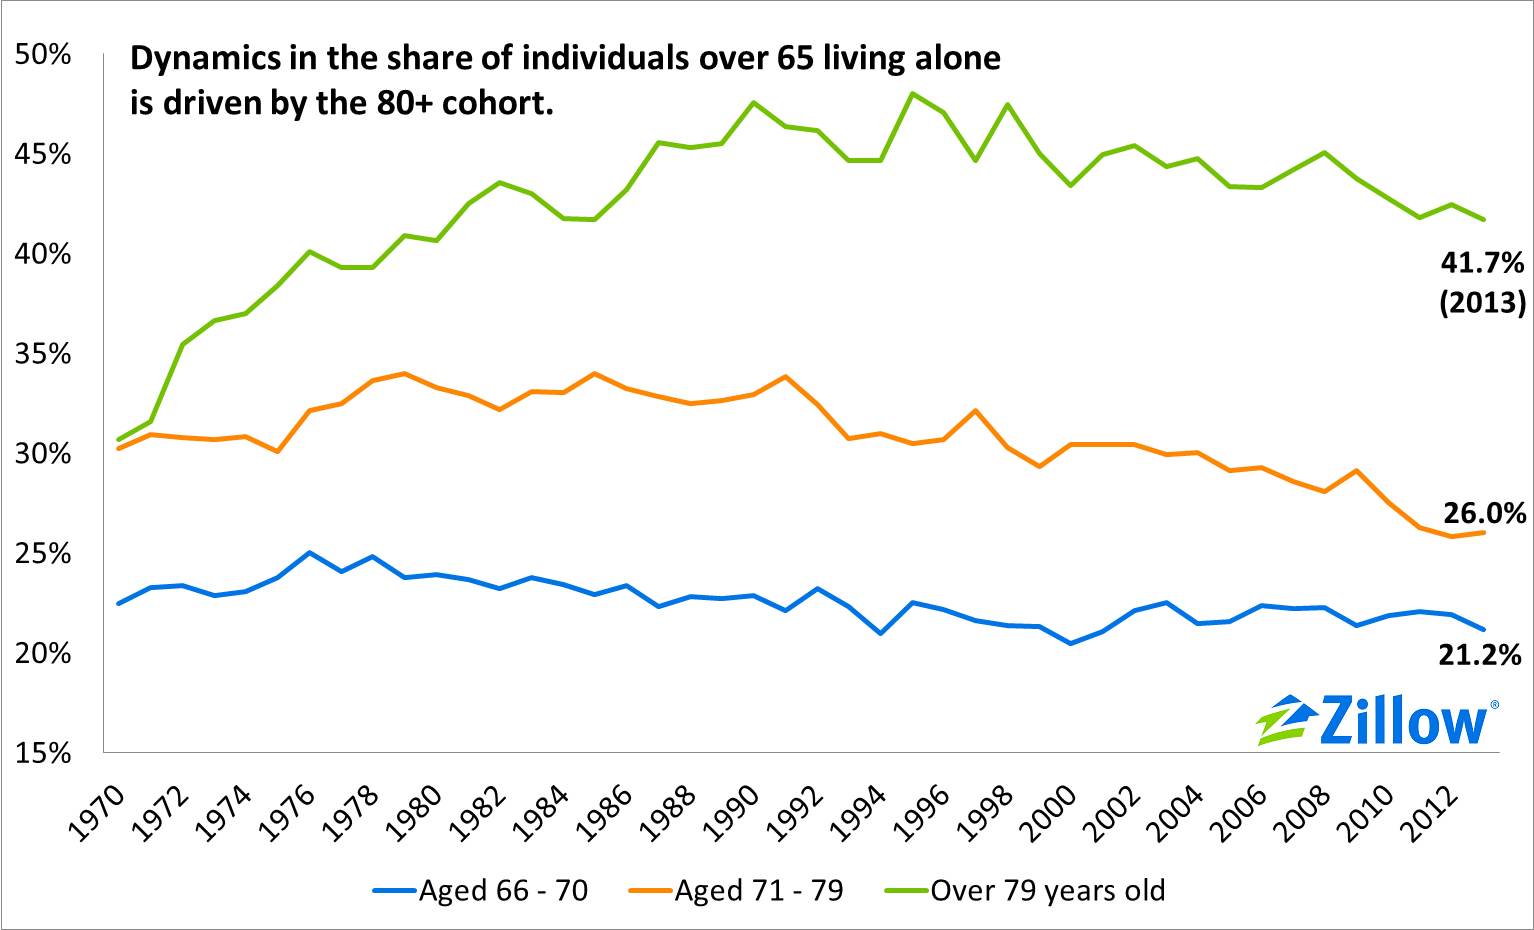
The patterns for senior citizens, those over 65 years, are very different. The share of senior citizens aged 66 to 79 living alone has fallen slightly, perhaps because of improved medical care and greater life expectancy, leaving fewer widows/widowers in this age group. By contrast, the share of 80- and 90-somethings living alone has trended sharply upward, reaching almost 50 percent by the mid-1990s. It has retreated somewhat since then, but more than 40 percent of senior citizens age 80 and above still live alone.
Living Alone in Good Company
Nationwide, 12 percent of working-aged adults live on their own, without family or roommates. Almost half (47.1 percent) of those lone wolves are Baby Boomers between 51 and 65 years old. Of the largest 50 metro areas included in this analysis, Cleveland and Buffalo have the largest percentage of adults living alone, at 16 percent and 15.7 percent, respectively. In Cleveland and Buffalo, 53.3 percent and 47.7 percent of those living alone are Boomers. In many metros, the ages of those living alone is more balanced. For example, in eight of the metros analyzed, millennials (those aged 23 to 34 years old) represent more than a quarter of those adults living alone.
