- American home buyers making the country’s national median income and buying the median-valued U.S. home could expect to pay 14.8 percent of their income on a mortgage as of Q1 – down slightly from 15.1 percent at the end of 2015, and well below the historic U.S. average of 21.2 percent.
- Renters making the U.S. median income and looking to rent the typical rental home nationwide should expect to devote 30.1 percent of their income to rent as of Q1, up from 29.8 percent at the end of 2015 and well above historic norms of 25.8 percent.
- Buyers in the lowest income tier should expect to spend roughly twice as much of their income on a mortgage payment for an entry-level home as buyers in the highest income tier buying a more expensive home.
Buying a home with a mortgage got slightly more affordable to start of the year, especially compared to renting. But while mortgage affordability overall has improved somewhat, for low-income Americans looking to buy even a modest home, affordability has actually gotten worse – at the same time as it improved for those earning more.
As of the end of the first quarter, the typical American home buyer making the country’s national median income and buying the median-valued U.S. home could expect to pay 14.8 percent of their income on a mortgage. That’s down slightly from 15.1 percent at the end of 2015, and well below the historic U.S. average of 21.2 percent (figure 1).
In general, the Midwest is home to the most affordable markets, with eight of the 10 most affordable large markets located in the region. The most affordable large markets nationwide in Q1 – where the typical mortgage consumed the smallest share of income – were Detroit (9.8 percent), Pittsburgh (10.4 percent) and Indianapolis (10.5 percent). Unlike the Midwest, California is far less affordable – overall, six of the nation’s 10 least affordable markets in Q1 were in California. The three least affordable large markets were San Jose (41.9 percent of the area’s median income is needed to afford a typical mortgage payment), San Francisco (40.5 percent) and Los Angeles (39.1 percent).
Those same three California markets also hold the dubious distinction of being the only large metro markets where a typical mortgage today is less affordable than it was historically. Bay Area residents in the San Jose and San Francisco metros can expect to spend 6.1 and 2.0 percentage points more of their income to a mortgage today, respectively. Los Angeles home buyers today should expect to devote 3.2 percentage points more of their income to a mortgage compared to prior generations.
In every other large market nationwide and the nation as a whole, the share of income currently necessary to afford a typical mortgage is less than it was historically – painting a picture of a broader housing market that, despite some ills, remains stable and affordable.
But looking at different segments of the market reveals a much different picture.
Affordability Tears
Depending on a given buyer’s income level and the kind of home they’re trying to buy, affordability can vary dramatically. Nationwide, a buyer earning a median annual salary in the bottom one-third of all incomes and looking to buy a home valued in the bottom one-third of all homes would need to spend 22.7 percent of their income on a mortgage as of Q2 2015, the latest quarter for which data is available.[1] A buyer earning an income in the top one-third and looking to buy a more expensive top-tier home would only spend 11.5 percent of their income on a mortgage (figure 2).
A year earlier, in Q2 2014, a U.S. buyer at the top would have had to devote 11.7 percent of their income to a mortgage. At the same time, a bottom-tier buyer would have needed to spend 22.5 percent of their income to a mortgage. So while mortgage affordability at the top has improved somewhat, it has actually gotten a bit worse at the bottom.
The reasons why mortgage affordability has suffered at the bottom at the same time as it has improved at the top comes back to two basic inputs used to determine affordability: Income and home price. Growth or contraction in either will lead to changes in affordability. And incomes at the top are growing more quickly than incomes at the bottom, while bottom-tier home values appreciate faster than those at the top-tier. Between Q2 2014 and Q2 2015, bottom-tier incomes grew 2.5 percent, compared to top-tier income growth of 3.5 percent (figure 3). Over the same period, bottom-tier home values increased 6.1 percent, versus 4.1 percent for top-tier homes (figure 4). Essentially, bottom-tier home values grew more than twice as fast as bottom-tier incomes, while top-tier incomes and home values grew at similar paces.
Points of Interest
Still, in both cases, home values grew more quickly than incomes, which should in theory have caused affordability to deteriorate to some extent across the board – and much more than it actually did at the bottom tier. But the reason top-tier affordability actually improved and bottom-tier affordability only suffered marginally comes down to the third main factor in affordability: Mortgage interest rates.
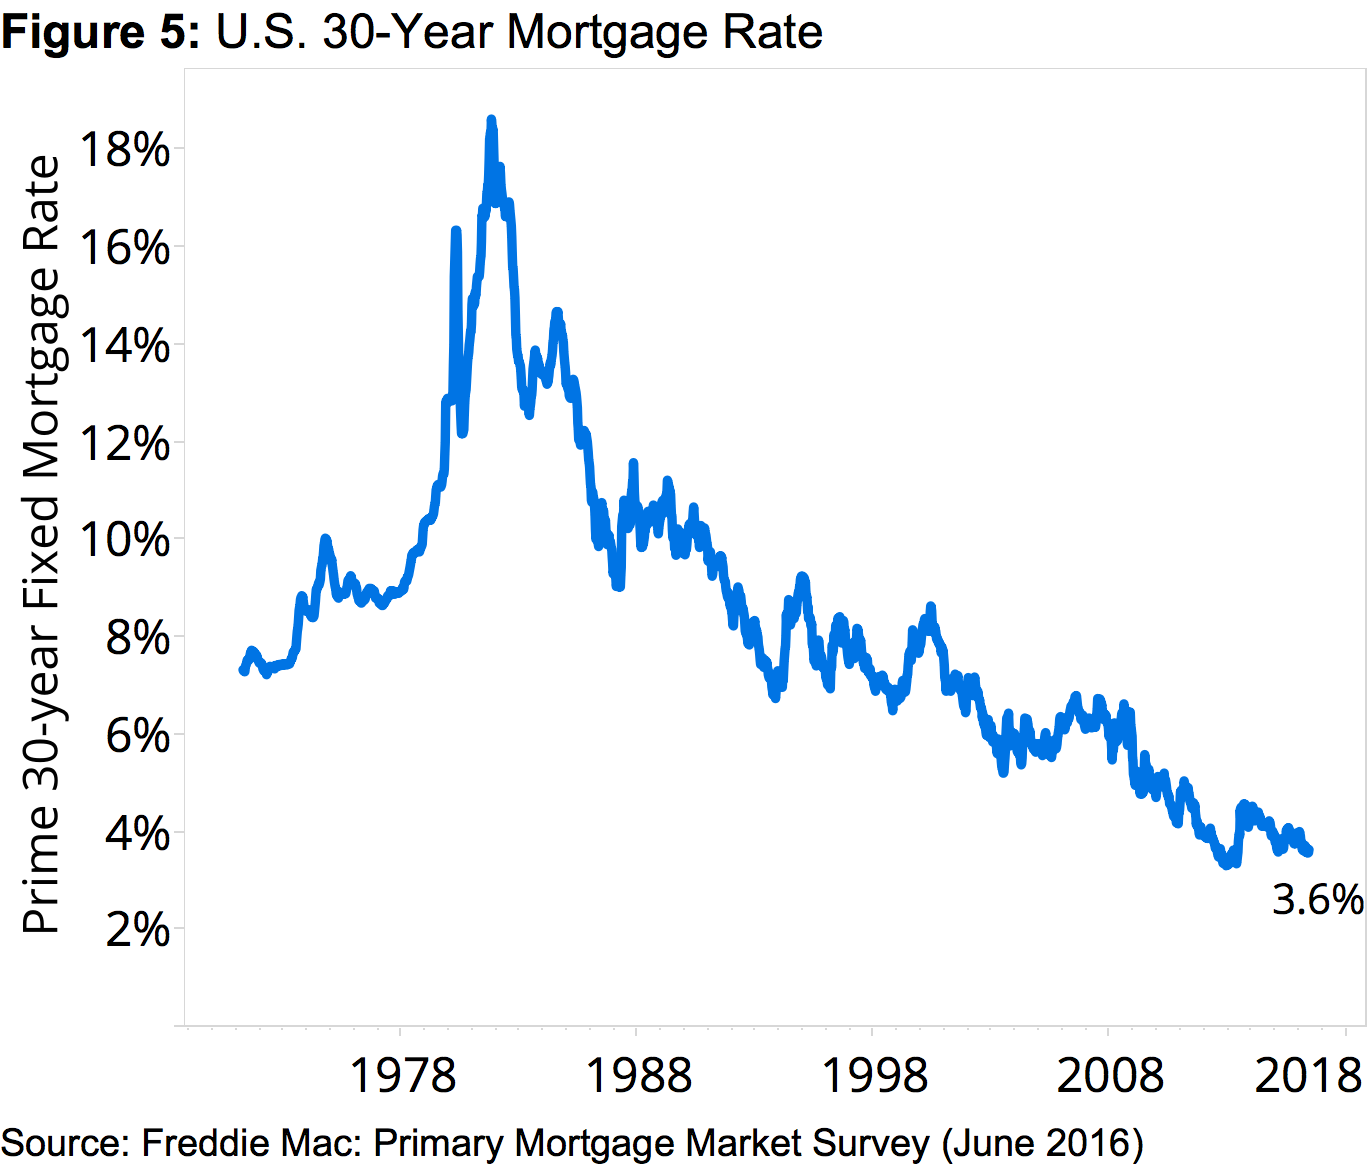 After the housing market hit bottom in early 2012 and the economy began picking up steam, most economists predicted that mortgage interest rates would begin to rise from the historic lows reached during the recession. But a series of global political, economic and security-related events have, instead, conspired to help keep mortgage interest rates low – and given continued instability around the globe, it’s likely rates will stay low for a while (figure 5).
Low mortgage rates are a boon for home buyers, allowing them to borrow more money but pay less for it in interest charges each month. In other words, low mortgage interest rates are masking what could be a much worse affordability situation given rapid home value growth and anemic income growth. If and when mortgage interest rates begin rising again in earnest, many pricey markets could be in for a rude awakening.
Which isn’t to say there aren’t currently some markets where affordability, especially for those at the bottom-end, is already nightmarish. Most financial experts advise spending no more than one third of income on housing costs. But as of Q2 2015, bottom-tier buyers in four (probably unsurprising) large markets could expect to pay much more than half of their income to a mortgage on an entry-level home: Los Angeles (76.1 percent of bottom-tier income needed to afford an entry-level home), San Jose (71.2 percent), San Francisco (68.4 percent) and San Diego (59.7 percent). Rounding out the top five – or bottom five, depending how you look at it – least affordable markets for entry-level buyers is New York (48 percent).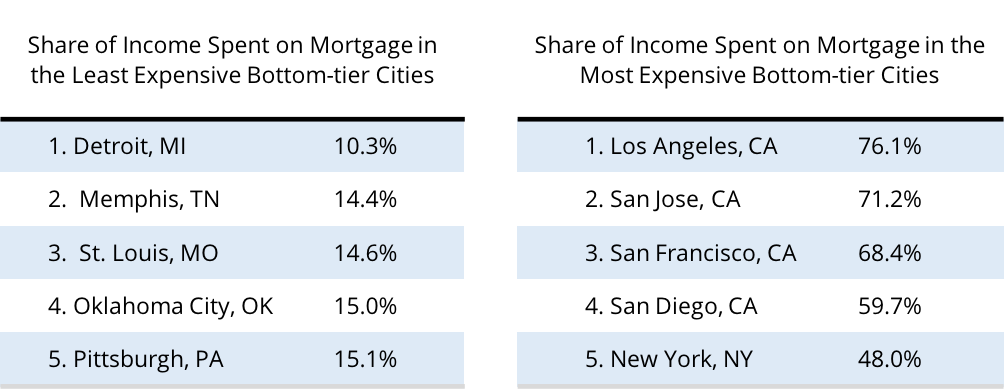
No Rent Concessions
Not to be lost in all this discussion of mortgage affordability are the roughly one-third of American households that rent their home. And for them, the affordability situation is plain bad – and getting worse.
As of the end of Q1, renters making the U.S. median income and looking to rent the typical rental home nationwide should expect to devote 30.1 percent of their income to rent, up from 29.8 percent at the end of 2015 and 29.6 percent a year ago and well above historic norms of 25.8 percent. Of the 35 largest metro markets nationwide included in this analysis, rental affordability today is worse than it was historically in all but two – Pittsburgh (24.8 percent currently vs 28.3 percent historically) and Sacramento (31.2 percent vs 31.7 percent).
Nationwide, the least affordable large rental markets include Los Angeles (47.6 percent of income needed to afford the typical rental home), San Francisco (46 percent) and Miami (43.9 percent). The most affordable rental markets in Q1 2016 included St. Louis (23.6 percent), Pittsburgh (24.8 percent) and Detroit (25.1 percent).
Methodology
To calculate mortgage affordability, we first calculate the mortgage payment for the median-valued home in a metropolitan area by using the metro-level Zillow Home Value Index for a given quarter and the 30-year fixed mortgage interest rate during that time period, provided by the Freddie Mac Primary Mortgage Market Survey (based on a 20 percent down payment). Then, we consider what portion of the monthly median household income (U.S. Census) goes toward this monthly mortgage payment. Median household income is available with a lag. For quarters where median income is not available from the U.S. Census Bureau, we calculate future quarters of median household income by estimating it using the Bureau of Labor Statistics’ Employment Cost Index.
The affordability forecast is calculated similarly to the current affordability index but uses the one year Zillow Home Value Forecast instead of the current Zillow Home Value Index and a specified interest rate in lieu of PMMS. It also assumes a 20 percent down payment.
We calculate rent affordability similarly to mortgage affordability; however we use the Zillow Rent Index, which tracks the monthly median rent in particular geographical regions, to capture rental prices.
In order to calculate affordability for low-income households, we use census data to calculate the median income of households in the bottom third of income. We then assume that they purchase the median bottom-tier home. At Zillow we define a bottom-tier home to be a home in the bottom third of home values in their metro. We then calculate what percentage of monthly income a household would have to spend to pay the mortgage. A similar process is done with the middle and top thirds of the home value and income distributions to produce a middle-income and high-income affordability.
[1]Income data is sourced from the American Community Survey (ACS), indexed forward because the ACS series ends several years ago. For median income used in the overall affordability analysis, we chain the income data forward using the Employment Cost Index (ECI), which is updated quarterly with a one quarter lag. But income tier data is not published in ECI. To get tiers, we rely on the Consumer Expenditure Survey (CES), which is published with a one-year lag, which is why our tier data is only available through June 2015 but our overall affordability is available through Q1 2016.

