Homes are Staying on the Market for Longer, Meaning That Sellers Must Offer Fewer Tricks and More Treats to Attract Buyers
The typical age of inventory is up 45% from last year, and is 30% less than the pre-pandemic average.
The typical age of inventory is up 45% from last year, and is 30% less than the pre-pandemic average.
Last year saw some of the hottest for-sale market conditions on record, with intense competition resulting in homes selling at breakneck speeds. However, the market has since cooled significantly and homes are now staying on the market for much longer, whether or not they sell. As of the week of October 16, Days on Zillow – a measure of the median amount of time that a for-sale listing has been on the market – was 54 days, up from the series’ lowest-ever recorded value of just 19 days in early April and from 38 days in the same week in 2021. At this pace, Days on Zillow is likely to reach 68 days by the end of the year, 10 days higher than where it was at the end of 2021. That said, this projected level would still be well shy of pre-pandemic time on market, indicating that some market competition remains, even with buyers pulling back in the face of affordability challenges, in part due to a muted flow of new for-sale listings.
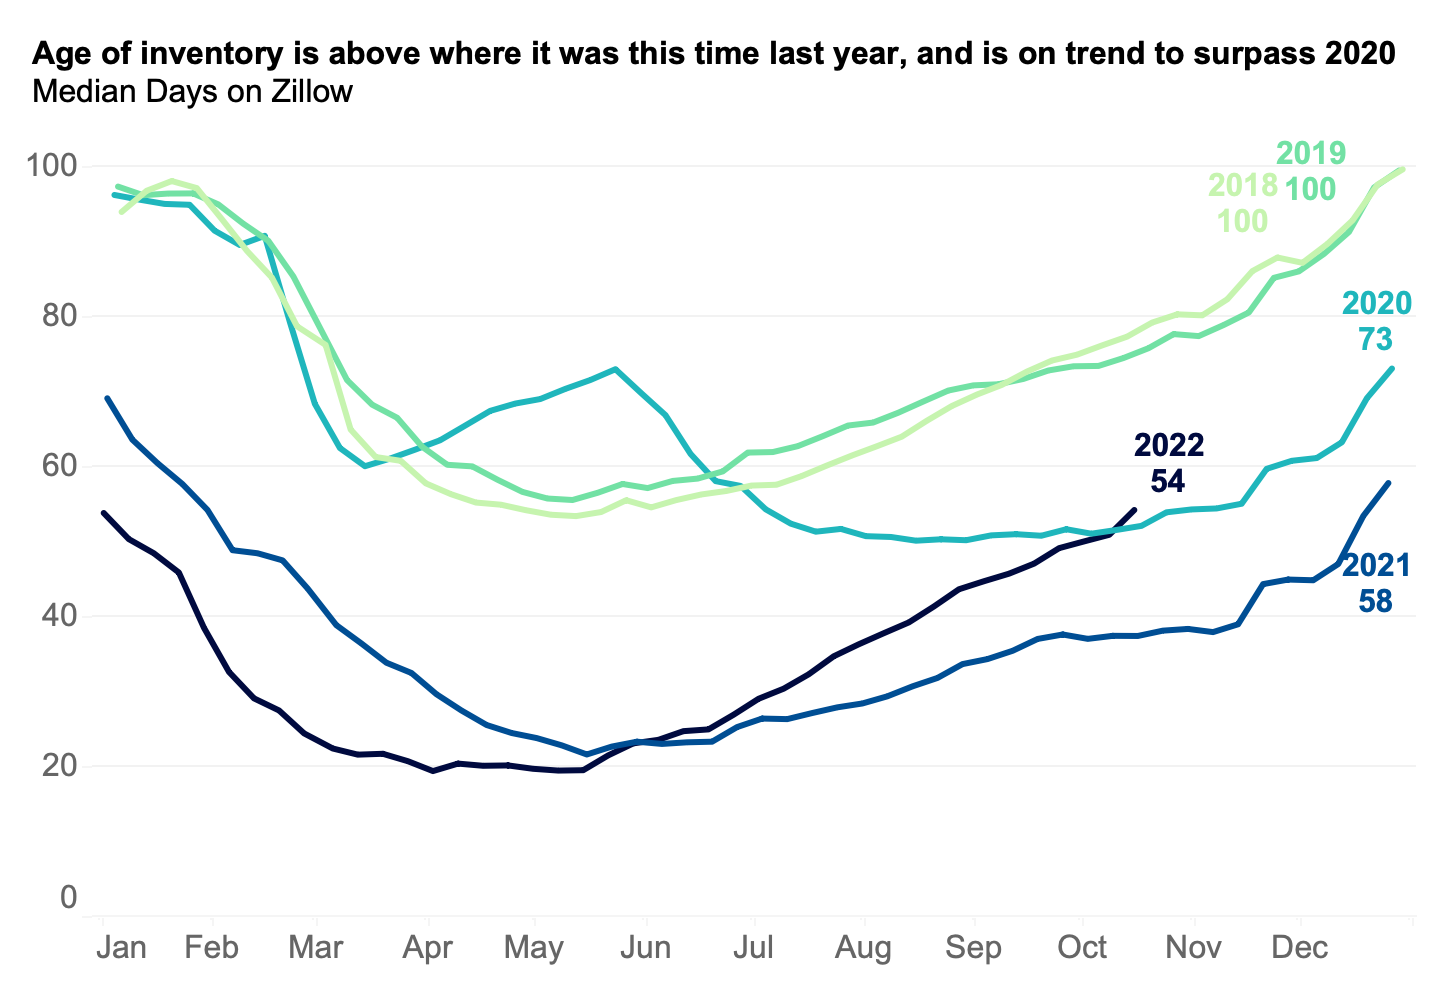
Days on Zillow experiences the typical seasonal peaks and valleys home shoppers are familiar with. The housing market tends to speed up in the spring leading into summer, and cools off in the fall and winter. Days on Zillow similarly reaches its lowest point annually in mid-May, when there are the most new listings coming on the market and more sales, and gradually increases towards its peak at the end of the year, when there are fewest new listings and slowing sales. But recent increases in the measure exceed what typical seasonality would indicate. Days on Zillow increased by seven days in the month ending October 22nd, 2022. The same period in 2019 saw an increase of just three days. In 2018, the measure rose five days in that span.
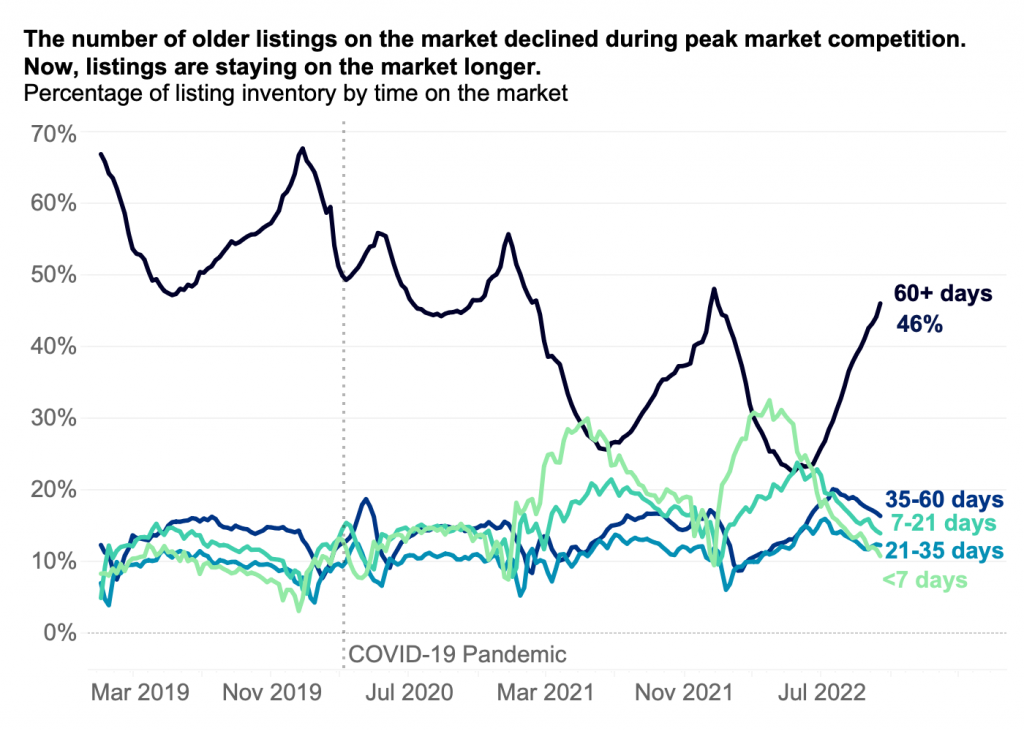
Slowdowns in both the supply and demand for homes have helped push Days on Zillow higher. Many would-be home sellers are holding onto their existing homes rather than listing them for sale, likely as a result of increasing interest rates, at least in part. When mortgage rates started rising this spring, the flow of new listings slowed from previous years’ trends. Through September, 7% fewer for-sale listings have entered the market in 2022 compared to the same period in 2021. With fewer homes entering the for-sale market, existing for-sale inventory represents a larger share of overall inventory, leaving Days on Zillow to naturally increase as these for-sale listings age. As a result, the share of inventory taken up by listings that have been on the market for seven days or fewer is down 42% compared to last year. With interest rates appearing likely to stay high for the time being, this dynamic will probably persist.
At the same time, the pace of buying has slowed as well. The share of inventory that has been on the market for at least 60 days rose to 46% in mid-October. As rates, and thus mortgage payments, stay high, many potential buyers are being priced out of the market, and affordability will likely not be on their side any time soon.
Competition for homes remains elevated in some regions, particularly affordable markets that didn’t see the intense price growth experienced elsewhere over the last few years. Major metro areas in the Midwest have had little change in the time homes spend on the market, while Western markets have seen homes lingering for far longer compared to a year ago. In fact, for-sale homes in Milwaukee and New Orleans are spending even less time on the market than a year ago. Contrast that with Seattle, Raleigh, and Salt Lake City, where, as of mid-October, homes are spending three times longer on the market than at this time in 2021. This is in line with the expectations from a panel of experts that the housing slowdown in the Midwest would be less pronounced than elsewhere in the country.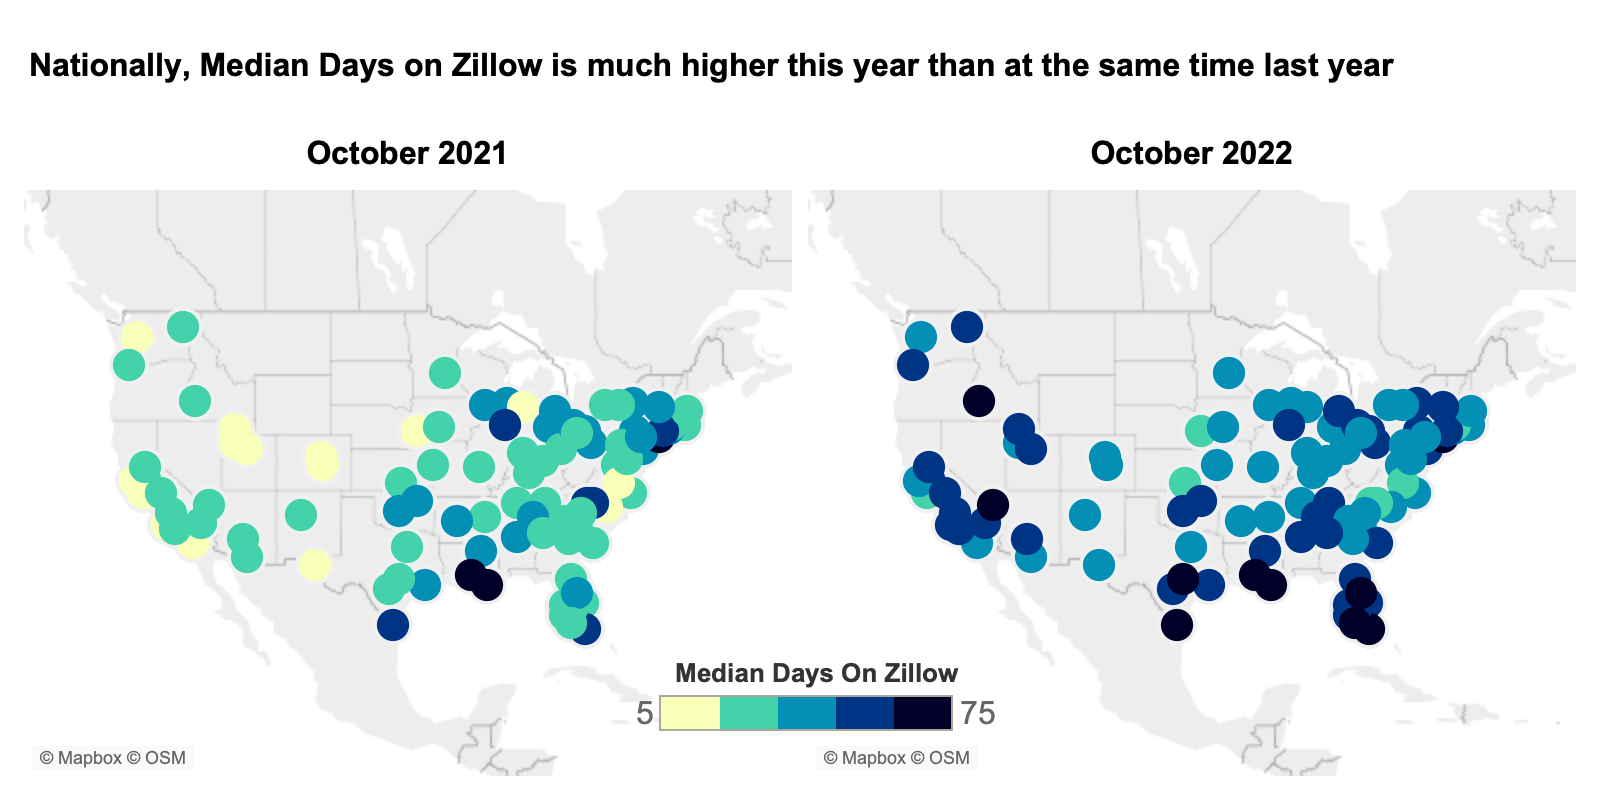
How is Days on Zillow different from days to pending?
As affordability is localized to different markets, so too is the way homes are staying on or moving off the market. While Zillow’s measure of days to pending does capture market speed, it excludes homes that haven’t yet gone under contract or those that may never go pending at all. Days on Zillow captures the age of inventory regardless of a for-sale home’s contract status, and therefore offers another view of the current state of the for-sale housing market.
The difference between these measurements offers helpful insights into the state of a given region’s housing market. In some areas, there is no difference in trend between these two metrics. In others, they show diverging trajectories. Markets that have still-low days to pending but a higher Days on Zillow suggest that competition remains fierce for desirable homes even as more homes are getting picked over and left behind.
Markets that saw intense home price appreciation during the pandemic are seeing both days to pending and Days on Zillow trending up together. This indicates that, across the board, competition is subsiding. Austin is one such market, where the typical home that went under contract took just over a week – 8 days — to do so in March. Now the typical Austin home that went under contract goes pending in a whopping 52 days – a six-week increase, and a level not seen since December 2018. Days on Zillow in Austin saw a similar jump in that same period, from 16 days to 61. In Las Vegas — another competitive market — the gap between the typical days to pending and total days on market is larger, but matching in trajectory.
But in some less competitive markets, including some in the Midwest, the typical home can still expect to go pending in less than two weeks, whereas the total time on market for all homes is rising fast. This indicates that the housing market is still very competitive for a subset of homes in these areas, but not all. The most stark example of this is St. Louis, where days to pending has stayed around seven days since January, but Days on Zillow has shot up a full month from nine days at its lowest to now 40. Hartford maintains its low Days to Pending at nine days, whereas Days on Zillow has increased 26 days from its low point earlier this year.
A continued uptick in Days on Zillow means that, depending on the market, buyers will have more time to consider their options before moving forward with a purchase than they likely had last year. That’s more time to shop around, consider their finances, and ultimately make the right decision for their household. For shoppers in formerly hot markets, this is welcome relief. However, for those in some markets, such as St. Louis, home buying conditions may still feel as competitive as ever.
For sellers, those that are thinking about listing their home today should expect for it to be on the market until Christmas, about two weeks later than what would have been expected last year. While this may feel like a long expected wait compared to the inferno-hot conditions of last year, it’s important to note that this time on market is still well below pre-pandemic norms.
