The Impact of the Amazon Jobs Boom on Seattle Rents
Across the Seattle area, the South Lake Union job boom is associated with faster annual rent increases between 2011 and 2015.

Across the Seattle area, the South Lake Union job boom is associated with faster annual rent increases between 2011 and 2015.
This brief updates an analysis published in April 2016 with more recent data.
Seattle has one of the strongest housing markets in the country with home value and rent growth consistently topping nationwide rankings in recent years. A strong local labor market has been an important driver of this growth, with the area being home to some of the country’s most dynamic companies, including Amazon and Microsoft (and, ahem, Zillow). Companies based elsewhere, such as Facebook and Google, have been increasingly drawn to establish satellite offices in the region.
The neighborhood of South Lake Union – home to Amazon’s headquarters – has been the epicenter of this jobs boom. Over the past decade, the area has transformed from a low-rise, post-industrial district to a cluster of high rises and amenities catering to service sector workers (e.g., coffee shops, kale salads, and yoga studios).
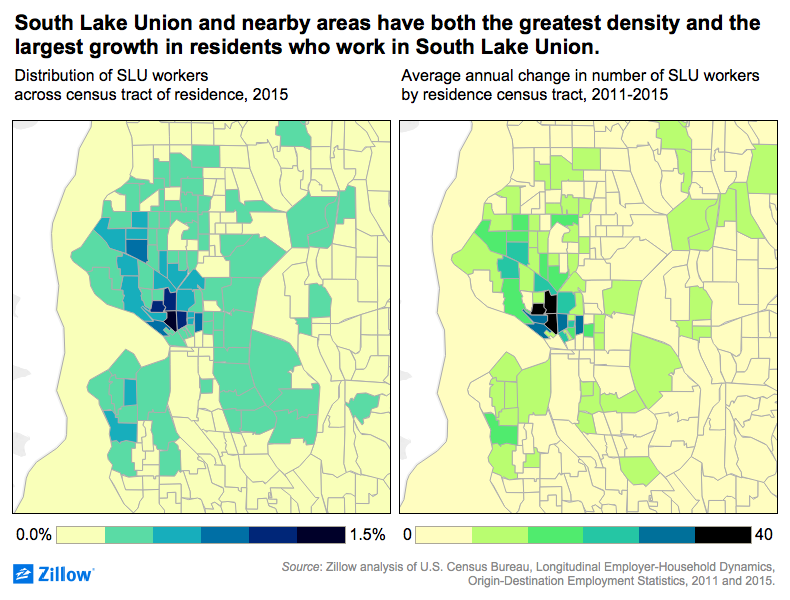
South Lake Union and adjacent areas are home to the highest concentrations of people who work in South Lake Union, and they have seen the largest growth in numbers of residents who work in South Lake Union – an area where the employment landscape is dominated by Amazon.
The maps below show the distribution of all employed adults who work in South Lake Union based on where they lived in 2015 (left) and the increase in South Lake Union workers between 2011 and 2015 (right).[1]
As of 2015, three out of every 200 employed adults who live in South Lake Union also work in South Lake Union, the highest density of such employees across the Seattle metro. In parts of Belltown, Capitol Hill, Lower Queen Anne, Interbay, Fremont and Ballard, one to two out of every 200 employed adults works in South Lake Union.
Seattle metro census tracts with larger increases in the number of South Lake Union workers between 2011 and 2015 saw larger rent increases (on a per square foot basis) over the same period. The figure below plots the relationship between the average annual change in the number of employed adults who work in South Lake Union across the census tracts where they live (horizontal axis) and the average annual change in median rent per square foot (vertical axis), both over the period 2011 to 2015.
For the average census tract in the Seattle metro, the South Lake Union jobs boom has been associated with faster annual rent increases between 2011 and 2015 of around $0.01 per square foot (or about $5 per month on a typical 650 square foot 1-bedroom apartment). Rents per square foot increased by about $0.05 per year on average over the same period metro-wide. So for the average Seattle metro census tract, the South Lake Union jobs boom only explains a small portion of rising rents in recent years.[2]
The relationship is stronger looking only at census tracts within the city of Seattle. For the average census tract inside the city of Seattle, the South Lake Union jobs boom has been associated with faster annual rent increases between 2011 and 2015 of around $0.07 per square foot (or about $44 per month on a typical 650 square foot 1-bedroom apartment).[3] Rents per square foot increased by about $0.11 per year on average over the same period city wide.
[1] For this analysis we include only workers with earnings of $40,000 per year or more.
[2] The coefficient of determination associated with this simple model is 0.17, which implies that differences in the growth of South Lake Union workers explains about 17 percent of the increase in rents per square foot across Seattle metro census tracts between 2011 and 2015.
[3] The coefficient of determination associated with this simple model is 0.3, which implies that differences in the growth of South Lake Union workers explains about 30 percent of the increase in rents per square foot across Seattle city census tracts between 2011 and 2015.
