- Zillow expects April’s new home sales to be roughly flat from March, remaining at 481,000 units (SAAR).
- An improving labor market, growing incomes and increasing demand from millennials – especially if homebuilders focus on building less expensive homes catered more to their needs – represent positive signs for new home sales.
- These positive influences could be held back if construction of new homes remains below historical averages. Strong April housing starts suggest a surge in new home sales by late summer.
Zillow expects next week’s April new home sales data from the U.S. Census Bureau to show almost no change from March, remaining at a seasonally adjusted annual rate (SAAR) of 481,000 units (SAAR).
Background
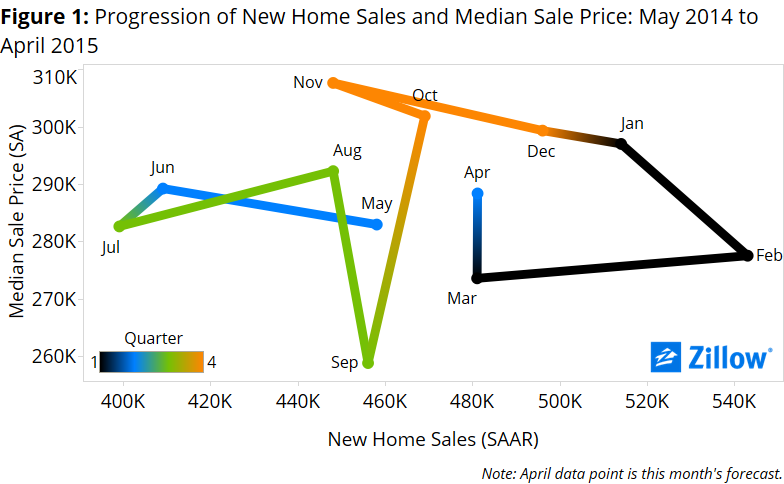
Recent new home sales data provide mixed signals going into the second quarter. Sales increased in December, January and February, before dropping 11 percent in March and erasing most of the gains made earlier in the year.
The median sale price, however, has fallen each month since November (figure 1) [i]. This potentially signals a shift in construction away from higher-end homes and towards the needs of younger, entry-level buyers, which would provide a needed boost to the market. The labor market continued to tighten in the first quarter of 2015 and is now just 2 basis points away from full employment [ii]. Income has been rising at a faster annualized pace over the past few years, and continued to do so in the fourth quarter of 2014, up 4.7 percent year-over-year in December.
After a brief two-month stint of rising mortgage rates, the interest rate on a 30-year, fixed-rate mortgage fell again in April to 3.67 percent, below its January level of 3.71 percent[i]. This decline comes at a time when markets are eyeing the Federal Reserve’s decisions closely in expectation of it lifting the floor for short-term interest rates from their historic lows as soon as this summer or early fall.
The slow pace of construction of new homes during the past few months could be a drag on new home sales volumes in coming months. Home starts fell drastically in February, down 15 percent month-over-month. March’s numbers did not come close to making up for the loss, with home starts up just 4 percent from February. However, April starts increased strongly – which should flow through to sales by late summer.
An improving labor market, growing incomes and increasing demand from millennials – especially if homebuilders continue to focus on building less expensive homes catered more to their needs – are reasons to be bullish on new home sales in coming months. But while construction growth appears OK, the number of homes under construction is still well below its historical average, and could outweigh the positive influences on new home sales.
April Forecast
Our new home sales forecast uses a best-fit combination of two models, a structural model and a historical model. The models point in opposite directions this month, with the structural model suggesting a decrease and the historical model suggesting an increase.
The structural model suggests new home sales will be down 0.2 percent month-over-month to 480,000 units (SAAR). According to this model, movements in underlying fundamentals over the past quarter should result in new home sales having very little change from March.
The historical model suggests an increase of 1 percent, to 586,000 units (SAAR). Changes in single-family home starts in winter 2014 – those homes most likely to be completed and ready for sale in April[ii] – combined with higher activity in prior months, suggest higher sales activity for April despite the large decline in March.
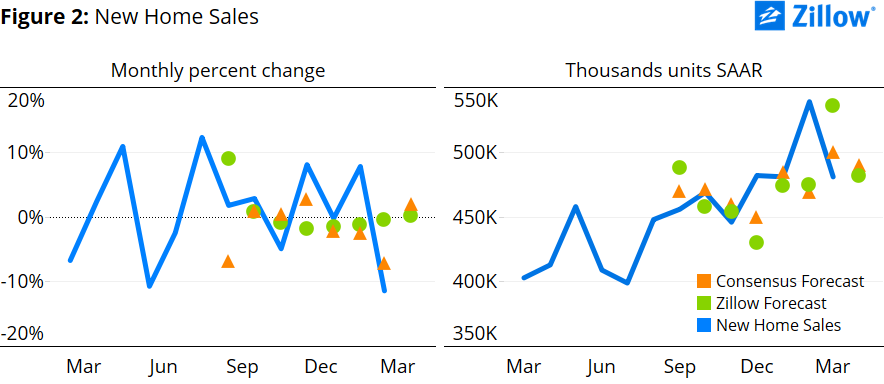
Using a best-fit combination of the two models, we obtain a point forecast of 481,000 units (SAAR), remaining unchanged from March (figure 2).
[i] According to Primary Mortgage Market Survey data provided by Freddie Mac.
[ii] According to the U.S. Census Bureau.
[i] We forecasted April’s median sale price using a best-fit ARIMA model – an ARIMA (5,1,0) in this case – to get a sense of the where the housing market will be this month in terms of a supply and demand framework. This forecast produced a median sale price of $288,500 and is represented along with our sales forecast for April in figure 1.
[ii] Full employment is defined as actual unemployment equal to the natural rate of unemployment. The actual unemployment rate for the end 2015 Q1 is 5.4 percent and the natural rate of unemployment is estimated to be 5.38 percent. Unemployment needs to drop just 2 basis points (or 0.02 percentage points) to reach full employment. However, there is some uncertainty associated with the size of the employment gap. It is likely to be larger as the labor force participation rate has been declining since 2007 due to demographic changes and discouraged workers who have yet to re-enter the labor market. Data used comes from the Congressional Budget Office.
