Anticipated Inventory Relief Fails to Materialize in April (April 2021 Market Report)
The ongoing inventory deficit deepened slightly in April -- total U.S. for-sale inventory was down 30.3% from April 2020 and 1.4% from March.

The ongoing inventory deficit deepened slightly in April -- total U.S. for-sale inventory was down 30.3% from April 2020 and 1.4% from March.
A much-anticipated inventory rebound failed to materialize in April as the Spring home shopping season arrived in full force, helping drive home value growth to new highs and accelerating an already fast-moving market. And this broad-based housing strength is increasingly spilling over into the previously soft rental market, according to the April 2021 Zillow Real Estate Market Report.
There were signs in March that the years-long, virtually uninterrupted nationwide decline in inventory may have begun turning a corner. But rather than making gains in April, the inventory deficit appears to have deepened slightly instead — total U.S. inventory was down 30.3% from April 2020 and 1.4% from March, from 30% year-over-year and 0.8% monthly declines in March. In some large markets, including Raleigh (-54%), Cleveland (-50%) and Providence (-45%), there were roughly half as many (or fewer) homes on the market this April compared to last.
Even so, the past two monthly declines are much shallower than the month-month declines registered in January and February, and we may be seeing a period in which inventory declines simply level off for a while before we see meaningful increases. A majority of experts recently surveyed by Zillow said they expect inventory to begin growing again in the second half of this year or early 2022. And like March, the national picture obscures some encouraging local trends. Inventory was up in April from March in 29 of the nation’s 50 largest markets, and was flat in a 30th market. Compared to a year ago, inventory was up in three large markets: San Jose (+37%), San Francisco (+32%) and Seattle (+3%).
Still, it’s clear the inventory shortage won’t reverse itself overnight, and that the relative lack of choice in the market is helping to drive home value appreciation to new heights and the time on market for those homes that do get listed to fresh lows. The typical U.S. home was worth $281,370 in April, up 1.3% from March and 11.6% from April 2020. Monthly appreciation in April was the fastest ever recorded in the 25-year history of the Zillow Home Value Index, and the annual growth rate was the fastest since 2005.
Annual appreciation was 10% or more in 39 of the nation’s 50 largest metros, led by breakneck year-over-year growth in Sun Belt and Southwestern metros including Austin (25.5%), Phoenix (20.4%) and Salt Lake City (18.3%). Some smaller, mid-size markets are experiencing even more scorching growth — annual home value appreciation in Boise, for example, was 32.5% in April. Even the relatively “slower-growing” markets are experiencing accelerating growth — home values in the San Jose metro area grew 5.9% year-over-year in April, slowest among the nation’s 50 largest markets, but still faster than the 5.2% annual pace recorded in March.
This accelerating growth can be attributed to a number of factors, including a recent decline in mortgage interest rates. One of the only headwinds for home price appreciation earlier this spring as they were on the rise, that headwind turned back into a tailwind in April. Average, 30-year, fixed mortgage interest rates slid from a recent high of 2.89% to as low as 2.66%, and ended the month at 2.71%.
Prior Zillow Research demonstrated that limited inventory can still be accompanied by healthy sales growth, assuming new listings hit the market at roughly the same pace as they have recently — but the tradeoff is in an accelerating speed of market. In April, the typical home nationwide was on the market for just seven days before accepting an offer and going pending. In some Midwestern markets, including Kansas City, Columbus and Cincinnati, listings were typically on the market for just three days before the seller accepted an offer. Buyers and sellers are finding creative ways every day to connect and get deals done, but there clearly is no denying that for buyers to succeed in this market, they have a deep need for speed.
In this current market, it may seem like one of those “creative” ways to ensure completion of a deal is to blow sellers out of the water by offering above asking price. But while above-ask offers and, especially, cash deals are tried-and-true methods for getting deals done, it’s useful to keep some context in mind. Despite abundant stories of bidding wars, not every house sells above list — in fact, it’s still fairly uncommon nationwide.
Yes, in a handful of metros — including San Francisco, San Jose, Seattle and Salt Lake City — it was more common than not for homes to sell above their initial list price earlier this year. But of all U.S. home sales that closed in February (the last month with full data), less than a third (28.6%) sold at or above their initial list price. That’s more than twice the share that sold above list in February 2020, but it still means the other 71.4% of homes sold at their list price or below. Metros with the lowest share of homes sold above list price are Miami (11%), Orlando (13%) and Las Vegas (15%).
Rental prices rose nationwide for the third month in a row in April, and are now growing at the fastest pace since the pandemic began: 1.5% month-over-month and 3% year-over-year, to a typical U.S. rent of $1,704/month. Rents rose month-month in April in every top-50 metro area except for Cleveland, where they slipped 0.3% from March but remained 6.1% above April 2020 levels.
Across the Sunbelt and Inland West, rents were substantially higher this April than a year ago, including Riverside and Phoenix, where rents are now 14.9% and 13.4% higher than a year ago, respectively. And the list of markets where rent remains down year-over-year has shrunk to just seven, generally pricier, larger and/or more-coastal areas: San Francisco (-7.7%), New York (-6.7%), San Jose (-6.6%), Boston (-4.1%), Seattle, (-3.0%), Washington, DC (-2.8%), and Chicago (-1.5%).
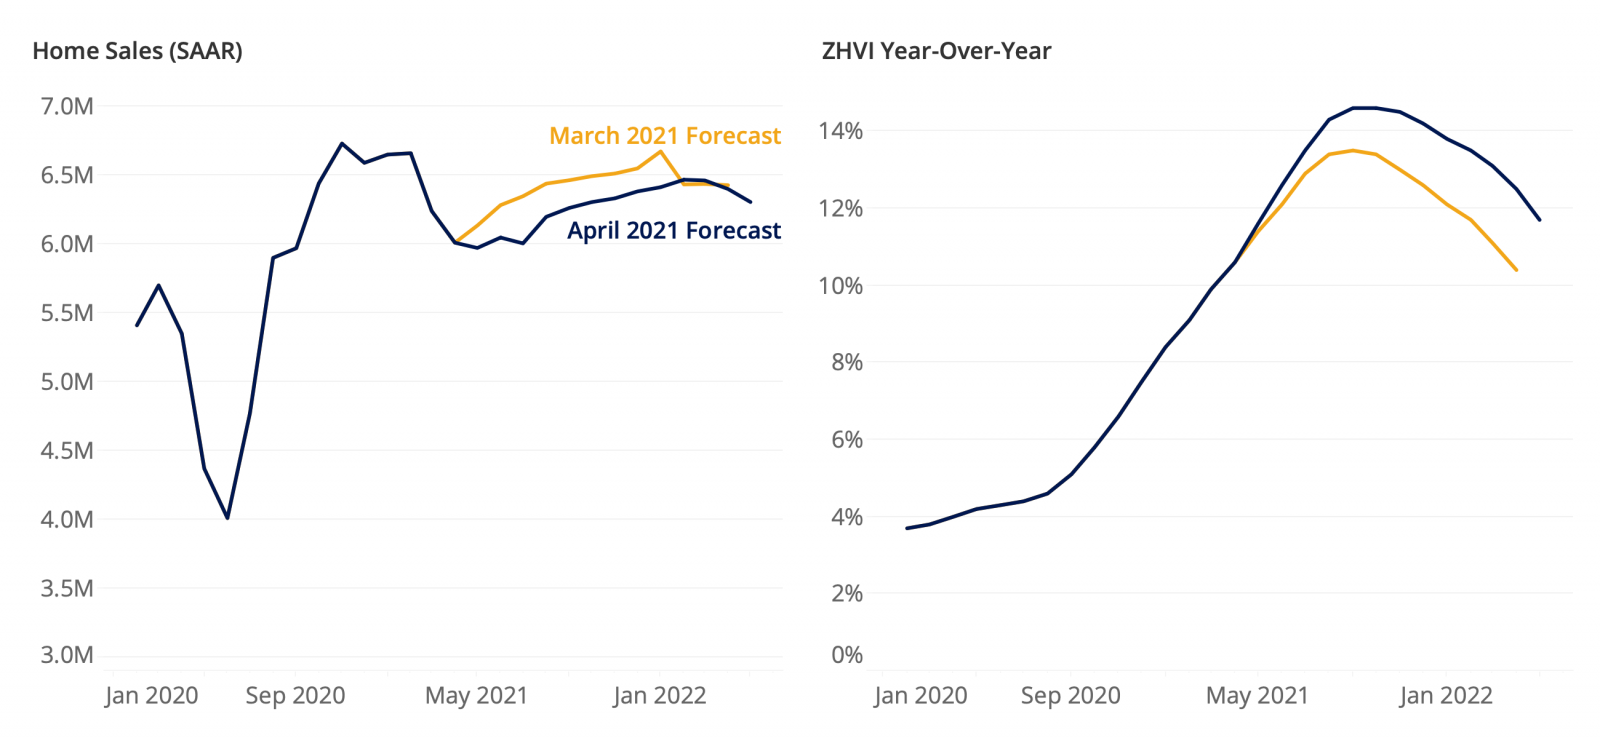
Zillow economists expect another year of rapid home value appreciation ahead of us, forecasting 11.8% growth through April 2022. Existing home sales in 2021 are predicted to be 10.3% higher than in 2020.
Annual home value growth is expected to end 2021 up 13.9% from 2021 (December 2020-December 2021). Recent rapid home value growth — monthly ZHVI appreciation has set new records in each of the past six months — has pushed our expectation for future growth higher over the past month. In our March report, our expectation was for 10.4% appreciation by March 2022.
On the sales side, our forecast has been revised down somewhat, though we still expect double-digit growth in sales in 2021 compared to 2020. In March, Zillow expected a total of 6.41 million existing home sales in 2021, slightly more than the 6.23 million sales currently forecast for this year. Mounting affordability concerns contributed to the slightly lower outlook, outweighing recent improvements in pending sales and mortgage application activity.
That said, enduring demographic tailwinds from the aging millennial and Gen Z generations, historically low mortgage interest rates and an improving economy should continue to support increased sales volume in coming months.
