Renters Need to Earn $100K in Twice as Many Markets Than in 2020 (April Rent Report)
Nationwide, the salary required to afford rent is $20K higher than it was five years ago
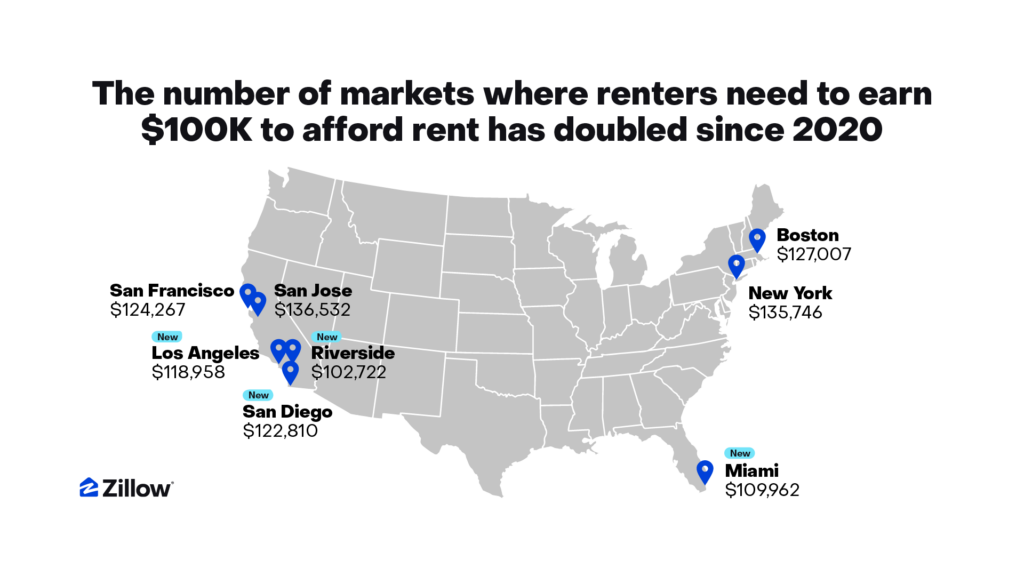
The rising costs of living have impacted affordability for renters across the country. Nationwide, renters today need to earn more than $80,000 to comfortably afford the typical rental, up from $60,000 just five years ago. In eight major metro areas, renters now need to make six figures to comfortably afford rent.
Since April 2020, rent for a typical U.S. apartment has increased by 28.7%, to $1,858, while rent for a single-family home increased by 42.9%, to $2,256. Over that time, the median household income1 has only risen by 22.5% to about $82,000 — showing that wages have not kept up with rents.
Housing costs have surged since pre-pandemic, with rents growing quite a bit faster than wages. This often leaves little room for other expenses, making it particularly difficult for those hoping to save for a down payment on a future home.
A renter making the median income and leasing a typical U.S. rental is just on the right side of the 30% affordability line — the rent burden threshold — spending 29.6% of their income on rent. To stay below that 30% line, renters in San Jose, New York, Boston, San Diego, San Francisco, Los Angeles, Miami and Riverside, California, generally need to earn six figures. The typical rent in these markets is many hundreds of dollars above the national asking rent of $2,024.
In six of these eight markets, the median household would spend over 30% of its income on a typical rental. However, in San Jose and San Francisco, wages have been better at keeping pace with rent. A median San Jose household would spend 25% of its income on a typical rental, while in San Francisco, it would spend 28%.
Despite a significant jump in rents over the past five years, plenty of markets are still affordable for median earners. The most affordable rental markets are Buffalo ($55K income required), Oklahoma City ($56K) and Louisville ($57K). In these markets, the median renter would spend 23% of their income or less on rent, allowing more latitude in gaining financial freedom.
Beyond high monthly rent prices, large upfront costs can pose a barrier for renters looking to move. This is especially true in cities like New York and Boston, where broker fees — on top of security deposit and advance rent payments of one to two months — exacerbate rental affordability challenges.
Rents
- The typical asking rent is $2,024 in April, up 0.5% month-over-month. The pre-pandemic average month-over-month change for this time of year is 0.7%.
- Since the beginning of the pandemic, rents have increased by 35.4%.
- Rents are now 3.4% up from last year.
- Rents fell, on a monthly basis, in 1 major metro area. The largest monthly drop is in Los Angeles (-0.1%).
- Rents are up from year-ago levels in 47 of the 50 largest metro areas. Annual rent increases are highest in Hartford (6%), Cleveland (6%), Chicago (5.9%), Providence (5.3%), and Kansas City (5.3%).
Single-Family Rents
- The typical asking rent for single-family homes is $2,256 in April, up 0.5% month-over-month. Since the beginning of the pandemic, single-family rents have increased by 42.9%.
- Single-family rents are now up 4% from last year.
- Single-family rents fell, on a monthly basis, in 4 major metro areas. The largest monthly drops in single-family rents are in Providence (-0.4%), Los Angeles (-0.4%), Riverside (-0.3%) and New Orleans (-0.2%).
- Single-family rents are up from year-ago levels in 49 of the 50 largest metro areas. Annual single-family rent increases are highest in Cleveland (7.5%), Chicago (6.5%), Indianapolis (6.5%), Los Angeles (6.2%), and Hartford (6.1%).
Multifamily Rents
- The typical asking rent for multifamily homes is $1,858 in April, up 0.6% month-over-month. Since the beginning of the pandemic, multifamily rents have increased by 28.7%.
- Multifamily rents are now up 2.9% from last year.
- Multifamily rents fell, on a monthly basis, in 3 major metro areas. The largest monthly drops in multifamily rents are in Oklahoma City (-0.2%), Phoenix (-0.1%) and Jacksonville (-0.1%).
- Multifamily rents are up from year-ago levels in 45 of the 50 largest metro areas. Annual multifamily rent increases are highest in Hartford (5.8%), Providence (5.7%), Chicago (5.6%), Columbus (5.2%), and Milwaukee (5%).
Rent Concessions
- 34.8% of rentals on Zillow offered concessions in April.
- The share of rental listings offering concessions decreased by 5ppts month-over-month in April.
- The share of rental listings offering concessions increased by 1.3ppts from last year.
- The share of rentals with concessions is lower, on a monthly basis, in 47 major metro areas. The largest monthly drops in the share of rentals with concessions are in San Jose (-11.8ppts), Hartford (-10.3ppts), Kansas City (-10ppts), Milwaukee (-9.8ppts), and Salt Lake City (-9.4ppts).
- The share of rentals with concessions is higher, on a monthly basis, in 3 major metro areas. The largest monthly increases in the share of rentals with concessions are in Charlotte (1ppts), Tampa (0.3ppts) and Austin (0.1ppts).
- Rent concessions are up from year-ago levels in 31 of the 50 largest metro areas. The annual increase in share of rental listings with concessions is highest in Denver (15.5ppts), Orlando (10.7ppts), Indianapolis (10ppts), Houston (8.5ppts), and Austin (8.4ppts).
Rent Affordability
- The median household would spend 29.6% of their income on a new rental in April.
- The pre-pandemic share of median household income spent on rent was 27.4%.
- The most affordable metro areas for rents are Austin (19.8%), Minneapolis (20.2%), Raleigh (20.6%), St. Louis (20.8%), and Salt Lake City (20.8%).
- The least affordable metro areas for rents are Miami (40.4%), New York (40.0%), Los Angeles (36.4%), Tampa (33.5%), and San Diego (33.2%).
- Income needed to afford rent increased by 3.3% year-over-year in April to $80,949. Since pre-pandemic, the income needed to afford rent has increased by 34.7%.
[1] Median household income is taken from the American Community Survey (ACS) through 2023. Present-day estimates combine changes in the Employment Cost Index provided by the Bureau of Labor Statistics to forecast current median household income.
