Rapid Growth of Asian-Headed Households Hides Significant Inequality
The widely diverse Asian American community is broadly prosperous by many metrics, but individual hardships faced by some groups cannot be overlooked.

The widely diverse Asian American community is broadly prosperous by many metrics, but individual hardships faced by some groups cannot be overlooked.
Rapidly growing homeownership, generally high household income and a host of other positive housing and economic measures should, on the surface, paint the nation’s Asian community as widely prosperous and successful. But painting with an overly broad brush covers over the more-checkered reality this hugely diverse community faces depending on their nation of origin, education and immigration status, and ignores big challenges including growing income inequality.
The nation’s Asian population — hailing from India to the Pacific Islands and most places in between — is one of the smallest but fastest-growing racial/ethnic groups in the country, according to a Zillow analysis of key Asian-specific housing and economic data conducted in honor of Asian American & Pacific Islander Heritage Month. Asians currently represent just 5% of the nation’s households. But in the two decades between 2000 and 2019, the U.S. Asian community grew by 83%, compared to Latinx household growth of 74%, Black household growth of 23% and largely flat white household growth over the same period.
And as their overall household growth swelled, so too did Asian homeownership. The Asian homeownership rate rose by 6 percentage points between 2000 and 2019, again outpacing the near-flat or falling rates of other racial/ethnic groups and closing the gap with white homeownership. At the same time, the median U.S. Asian household income is the highest of all the nation’s racial/ethnic groups, and Asian-owned homes are typically worth more than homes owned by other groups, even surpassing white home values.
But this seemingly sunny picture is at odds with the cloudier truth around the diversity of economic standings across the broader Asian population. Income inequality is rising most rapidly among Asians, and the income distribution among Asian households — in 1970, the most equal among all major U.S. racial/ethnic groups — is today the most unequal in the country. The median Asian household income is higher than the overall metro median in 49 of the country’s 50 largest metros. But in 24 of those 49 markets, the Asian household poverty rate is also higher than the metro median.
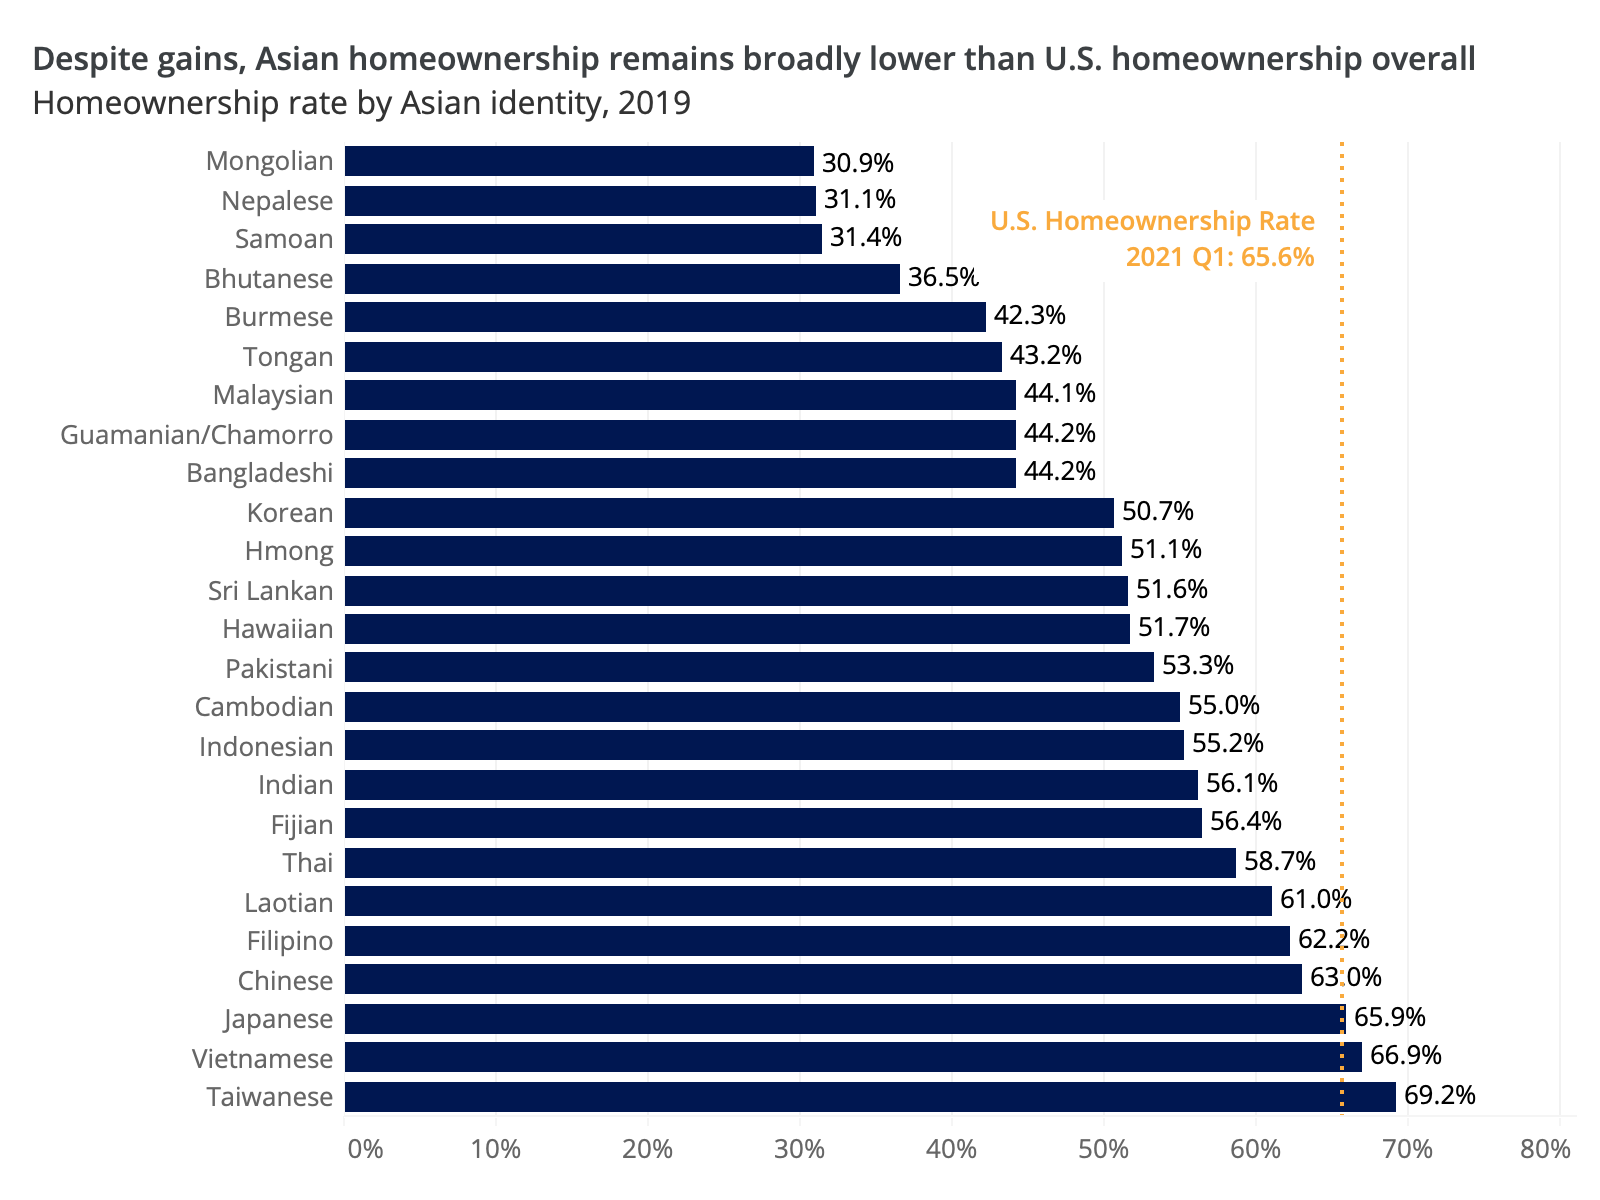
Disparities in incomes and homeownership rates become apparent when looking at Asian households from different regions of Asia itself: East Asian, South Asian, Southeast Asian and Hawaiian/Pacific Islander. East and Southeast Asians (including Chinese, Japanese, Vietnamese and Filipinos) have homeownership rates more than 60% and median household incomes approaching $80,000/year. But Pacific Islanders (including Native Hawaiians, Fijians and Samoans) have a homeownership rate of 43% — a level more in line with Black and Latinx homeownership rates of 42% and 47%, respectively — and a median household income of $65,000/year.
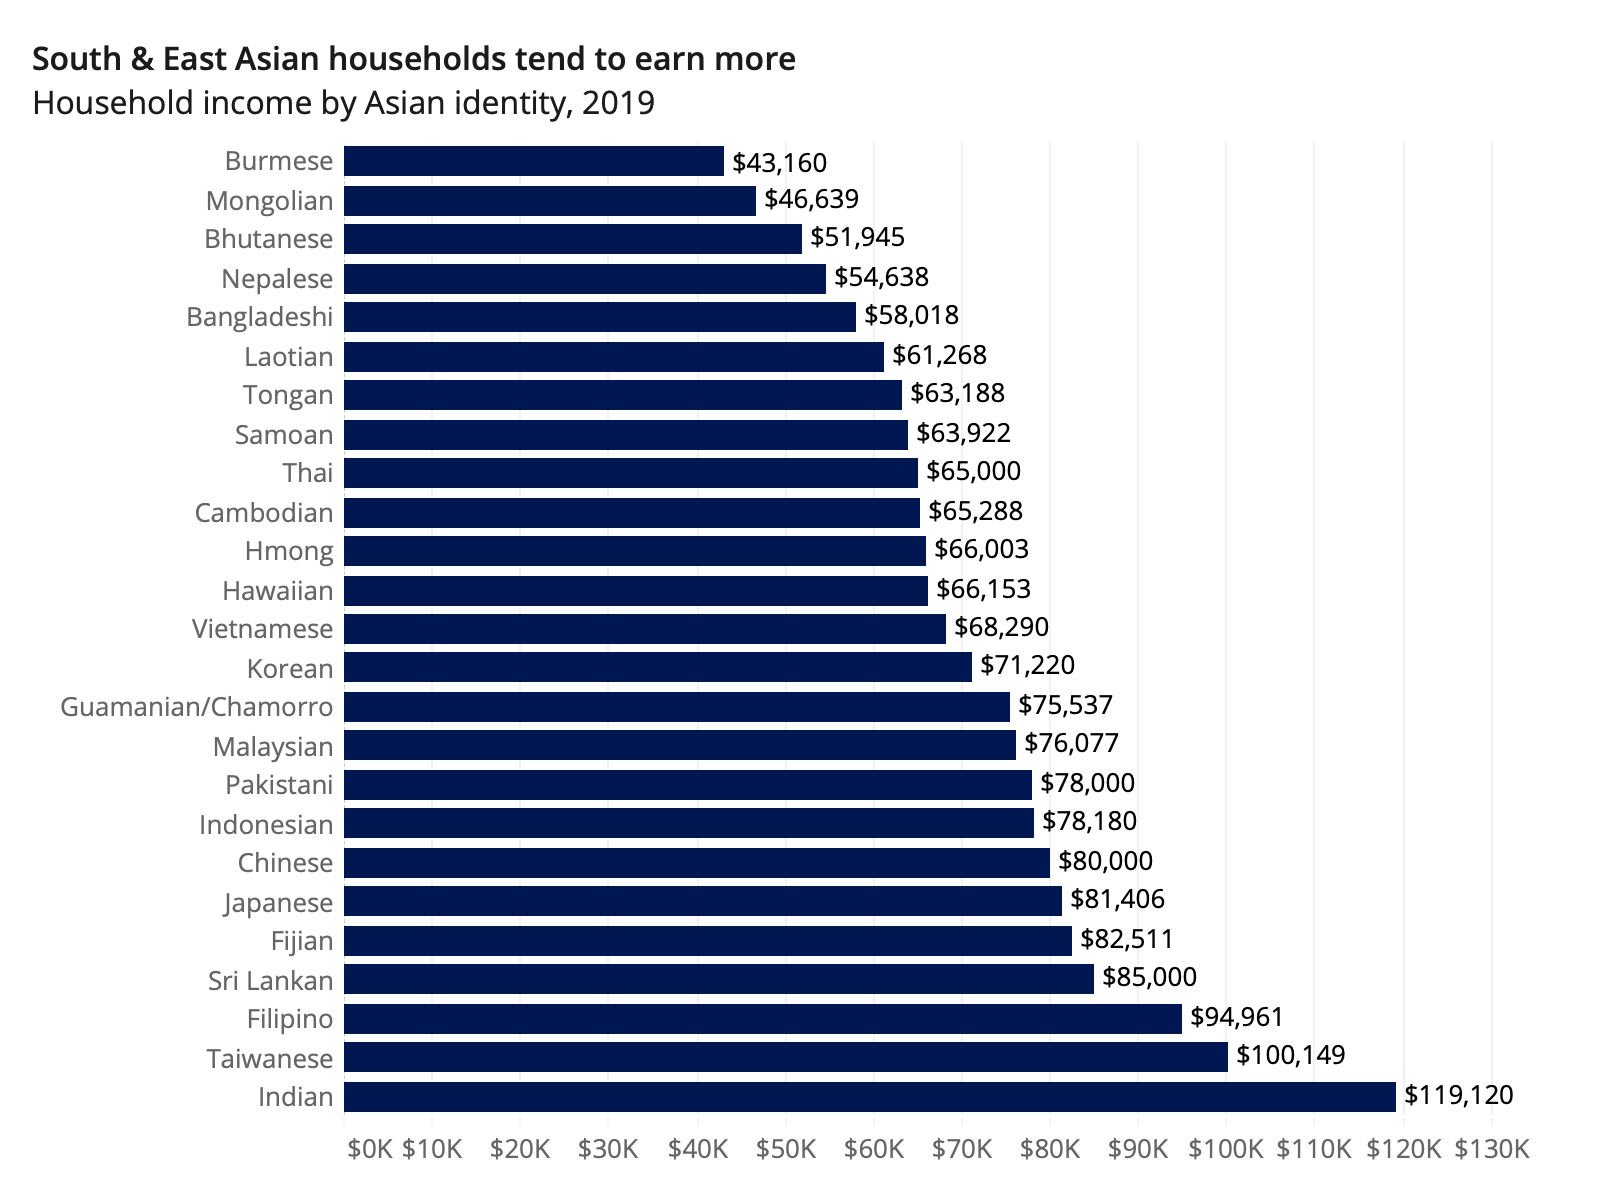
And there are sharp disparities among Asian households from different nations, too. Among the larger East Asian ethnicities, Chinese, Japanese, and Taiwanese-headed households all have homeownership rates over 62% — up to 69% for Taiwanese. But the Korean homeownership rate is only 51%, and Korean household incomes are also the lowest among these four groups. Among Southeast Asians, Burmese and Hmong homeownership rates are just 42% and 51%, respectively — about 10-20 percentage points lower than the group overall, which largely consists of relatively more prosperous Filipino and Vietnamese households. South Asian households (including Indians, Pakistanis, Bangladeshis, Nepalese and Sri Lankans) have by far the highest incomes of any other regional group — more than $110,000/year, compared to the East Asian median of $78,500, second-highest among Asian subgroups. But 84% of members of the South Asian group are of Indian descent, and the relative success of Indians is clearly boosting the broader South Asian numbers. And despite the high incomes of Indian households, their homeownership rates are still relatively low at 56%.
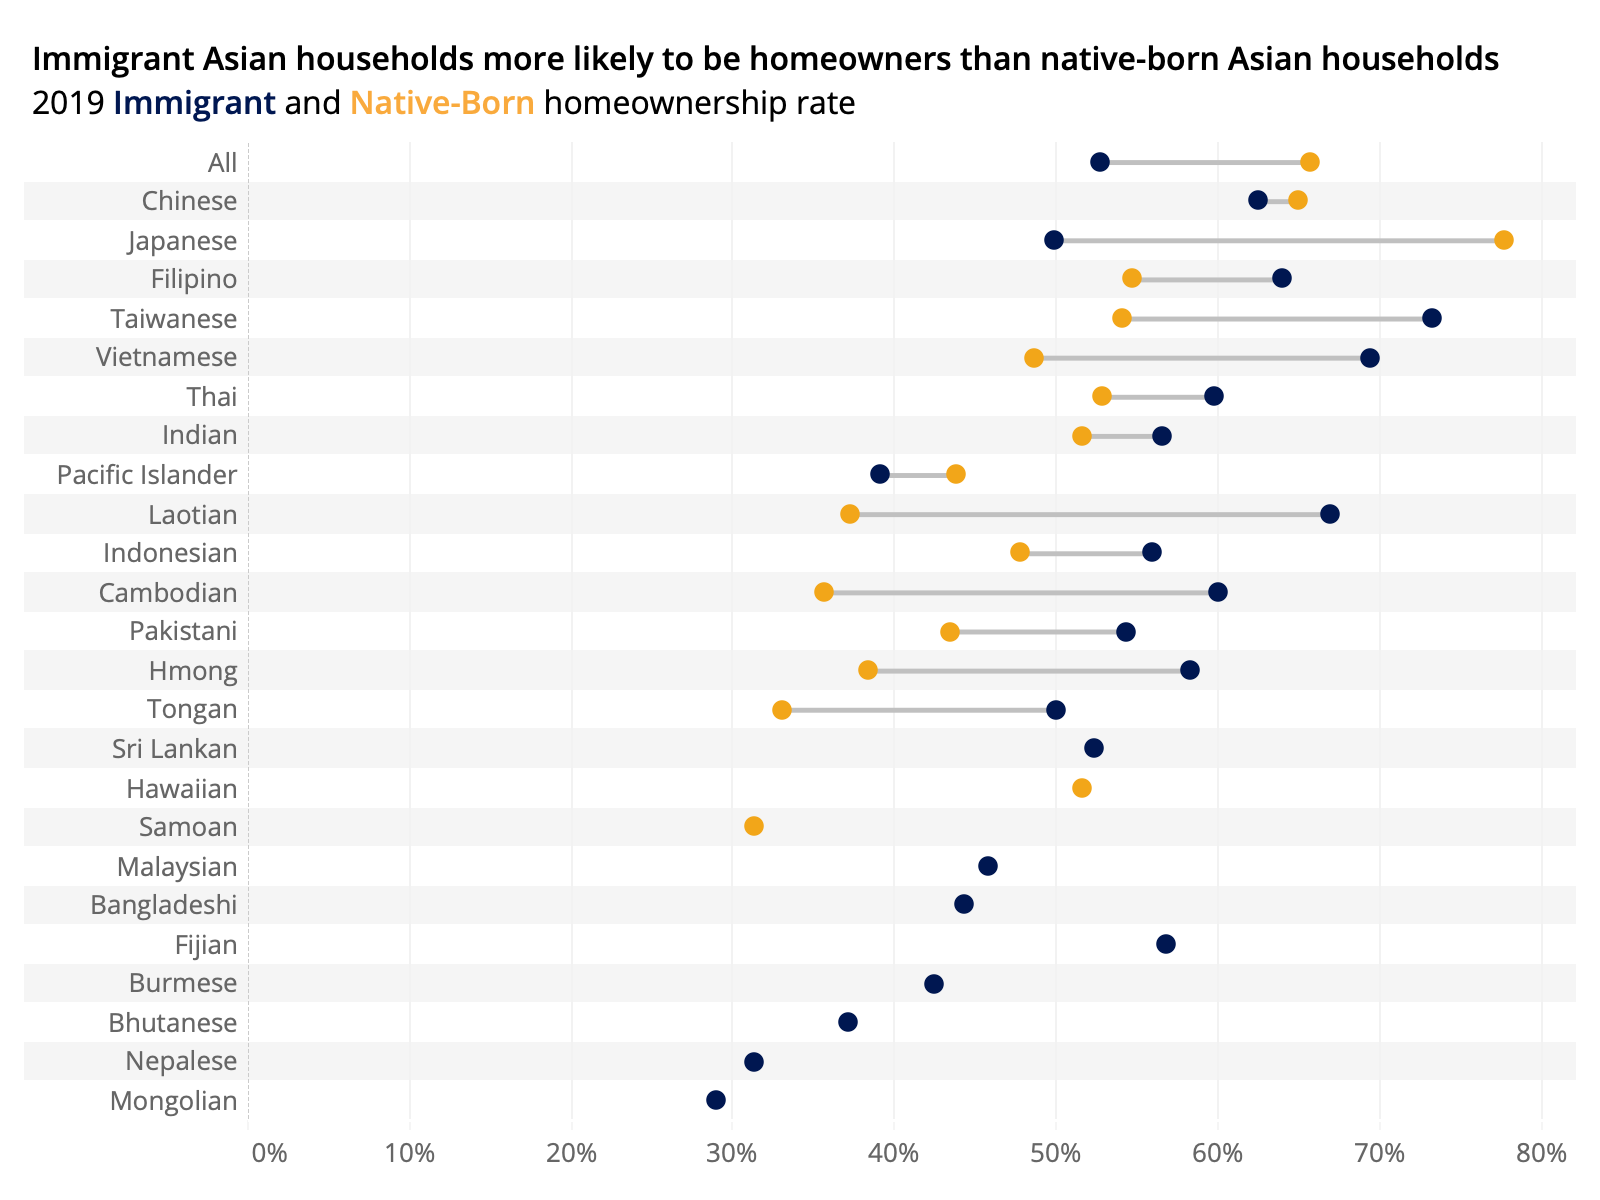
The wide-ranging economic situations of Asian households can be explained in large part by trends in immigration. A large majority of Asian household heads are foreign-born (81%), and a significant share of permanent residents from some Asian countries are refugees, including Bhutan (94%) and Burma (66%), potentially leading to relatively higher levels of poverty and lower incomes among these immigrant households once they arrive in the U.S. But Asians overall were also more likely than other groups to obtain green cards via employment-based preferences in 2019 — 21% of Asian immigrants came to the U.S. that year via an employer-sponsored arrangement, compared to just 14% of all immigrants. These immigrants, recruited for their specialized knowledge by often deep-pocketed U.S. corporations, may be quite highly paid and could end up better off than those coming to the country for other reasons.
And on the whole, immigrant Asian households are slightly more likely to be homeowners than native-born Asian households (59% vs 57%), reversing the overall U.S. trend in which immigrants are much less likely to own a home (53% among immigrants vs 66% for native-born households). This increased likelihood of immigrant homeownership is a recent development — in 2000, native-born Asian homeownership was 60%, compared to 52% for immigrant Asian households.The homeownership gains among immigrant Asian households are likely in part due to recent trends in high-skilled immigration from the region and also attributable to a shift in the typical ages of immigrant and non-immigrant households. In 2000, the median age of both immigrant and non-immigrant Asian households was 43. In 2019, the median age of immigrant households was 47, compared to 39 for non-immigrant households — and in general, all else being equal, homeownership rates rise with age.
Despite wide differences based on nationality, immigration status and/or education, Asian Americans as a broader group do indeed seem to be doing better than other groups, especially when it comes to their typical household incomes. But even there, the headline statistics can be deceiving. More than a third (35%) of the nation’s Asian households live in the New York, San Francisco, San Jose or Los Angeles metros — four markets that are home to only about 12% of the nation’s total households. And incomes in these generally pricier markets are typically much higher than the national median, ranging from 16% higher in L.A. to almost double the national median (97%) in San Jose. Essentially, the concentration of Asian households in these high-cost metros skews their headline, national median income upwards. And because there are such high concentrations of Asian households in these expensive areas, their homeownership rates are lower and cost burdens higher — despite higher incomes — than the overall population.
But over the past few years, Americans overall have tended to move away from these costly coastal metros in favor of less-expensive locales — a trend that is especially true among Asian households. Between 2000 and 2019, the share of Asian households living in New York, San Francisco, L.A. or San Jose fell by 4 percentage points (from 39% to 35%), while the share of all American households living in those areas fell by less than one percentage point (from 12.4% to 11.5%). In just the last two decades, the largest gains in Asian homeownership have occurred in smaller metros with relatively smaller Asian populations, led by New Orleans (+17.5pp), Austin (+14.4pp) and Raleigh (+13.3pp).
By sheer virtue of their growing numbers and wide diversity of backgrounds and cultures, Asian households will continue to play a large role in shaping the country’s housing and economic trends for years to come. But while the outward success of the group as a whole is likely to continue to grow, the individual hardships faced by some families or certain groups cannot be overlooked. Asian Americans continue to grapple with the same difficult immigration environment, unequal access to opportunity and disparate educational backgrounds common to virtually all racial/ethnic groups in America today. As the nation’s Asian diaspora continues to grow, so too will the number of Asian households facing hardship.
This analysis relies on 2019 5-year sample American Community Survey data and the 2000 Census 5-percent sample, sourced from IPUMS. Data for whites, Blacks and Asians include single-race, non-Latinx respondents. Asians include Asian and Native Hawaiian/Pacific Islander respondents. Household race/ethnicity is defined by race/ethnicity of the householder. Breakdowns by AAPI region include the following detailed race categories:
Unless otherwise specified, these country names are used to reflect race regardless of nationality or immigration status.
