Rents Climbed Modestly Again in August (August 2023 Rent Report)
Annual rent growth cooled again, to 3.3%, in August.
Annual rent growth cooled again, to 3.3%, in August.
Asking rents climbed by 0.3% in August, to $2,052, according to the latest edition of the Zillow Observed Rent Index (ZORI). Typical asking rents are now 3.3% higher than one year ago, continuing a steady, 18-month-long slowdown in the annual growth rate since hitting a record-high 16% in February 2022. In fact, August’s annual growth rate is now solidly below the annual pace observed just prior to the pandemic: year-over-year growth hovered between 4.0% and 4.2% in 2019.
The 0.3% monthly increase is a step down from July’s 0.5% monthly growth, but a little faster than the average pre-pandemic August increase of 0.2%, averaged over data from 2015 to 2019. Along with July, that makes two months this summer of rent growth slightly higher than pre-pandemic seasonal averages, after several months of cooler growth. That could reflect rent growth’s underlying resilience, or a change in seasonal norms after the pandemic upended normal patterns. Nonetheless, rents are growing at a substantially slower monthly pace than last August (0.6%), or their monthly pace in August of 2021 (1.8%).
Among the 50 largest metropolitan areas, rents rose the most on a monthly basis in August in Buffalo (1.0%), Cleveland (0.8%), Birmingham (0.7%), Columbus (0.7%) and Milwaukee (0.7%).
The lowest monthly change in rent was observed this August in Austin (-0.6%), Las Vegas (-0.1%), Portland, OR (-0.1%), San Antonio (-0.1%), and San Francisco (0.0%).
Annual rent growth was highest in Hartford (7.3%), Providence (7.2%), Buffalo (6.3%), Chicago (6.0%), and Boston (5.8%).
The weakest year-over-year rent growth can mostly be found out west. On a year-over-year basis, rents are down 2.5% in Austin and down 2.1% in Las Vegas, and have increased the least in San Jose (0.1%), Phoenix (0.2%), and Portland, OR (0.2%). These include some of the markets most exposed to tech industry hiring weakness, as well as some of the top destinations to which remote workers decamped earlier in the pandemic.
The most expensive major market is New York City ($3,412), San Jose ($3,386), San Diego ($3,207), San Francisco ($3,173), and Boston ($3,000). That continues a trend first observed in July, of the Big Apple’s metropolitan area having the highest asking rents in the nation.
The cooldown in official rent inflation, presaged by the slowdown in ZORI growth last year, is continuing apace: The annual growth rate of the Rent of Primary Residence component of the Consumer Price Index (CPI) fell from a peak of 8.81% in March to 8.03% in July. Moreover, the monthly growth rate has dipped to a 4.98% annualized pace, which will further pull down the observed annual growth rate if sustained. The second half of 2022 featured especially hot CPI rent readings, so the year-over-year comparisons will look ever more favorable in the coming months. It takes time for disinflation to fully factor into monthly CPI prints, though. That means the large shelter component in both CPI and the Fed’s preferred Personal Consumption Expenditure price index will contribute to the appearance of elevated inflation for several months to come.
Rent (and generally, shelter) inflation is looming particularly large, as the annual growth rate of all other components of the CPI fell to about 1% this summer, from a more-than-40-year high of 10.8% in June of last year.
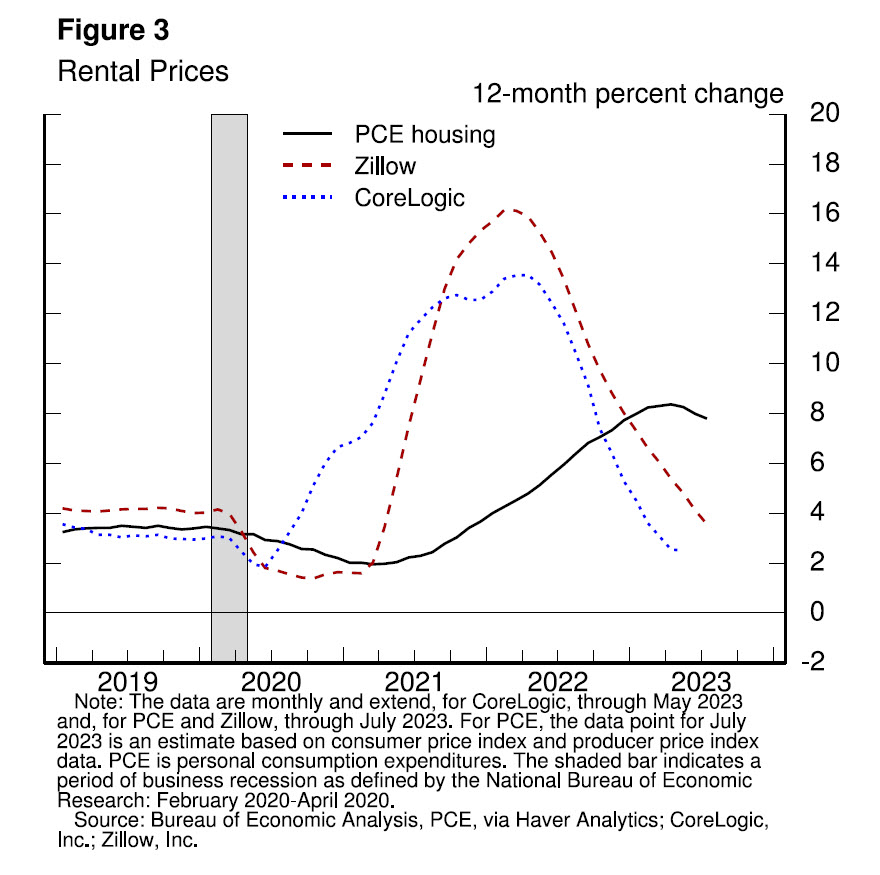
The pace of rent disinflation is being keenly watched by the Federal Reserve: Jerome Powell dwelt on rent growth in his prepared remarks at Jackson Hole on August 25, and he included a figure comparing annual growth in ZORI to that of the PCE price index’s housing component. He concluded his remarks on rent inflation by saying, “ …[w]e will continue to watch the market rent data closely for a signal of the upside and downside risks to housing services inflation.” We will as well.
