New Home Construction Bulks Up: Denser and Bigger

Increasingly, home builders are doing more with less, and in some surprising ways and places.
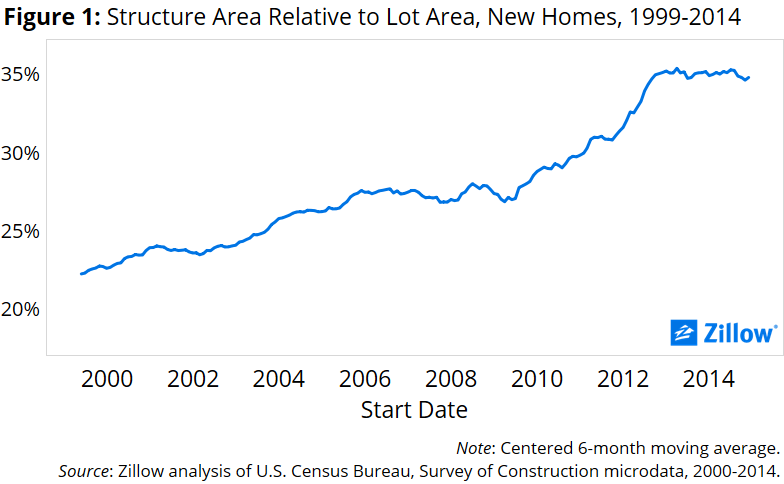 The ratio of structure area to lot area of new homes – or how much of the lot is covered by the home – increased steadily during the recession, and has remained at historically high levels during the recovery.[1] In other words, builders are putting more home on less lot, continuing a years-long trend that began in the late 1990s, paused somewhat during the recession, and has accelerated over the past few years. The factors driving that trend, and the characteristics of new homes themselves, reveal changing priorities for both new home builders and buyers.
In the early 2000s, the typical newly constructed home had three feet of yard space for every one foot of finished indoor space. By late 2014, the typical newly constructed home had just under two feet of yard space for every one foot of finished indoor space (figure 1).
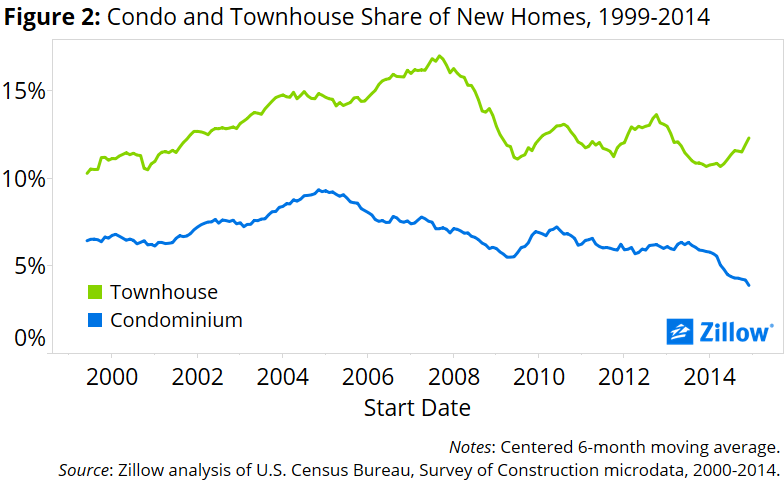 The easiest explanation for the shift could be that builders are building more townhomes and condominiums, homes that typically feature little to no yard space and which would naturally increase density. Except the share of new construction that is townhomes or condos isn’t growing (figure 2). Instead, the shift in density is being driven by detached single-family homes.
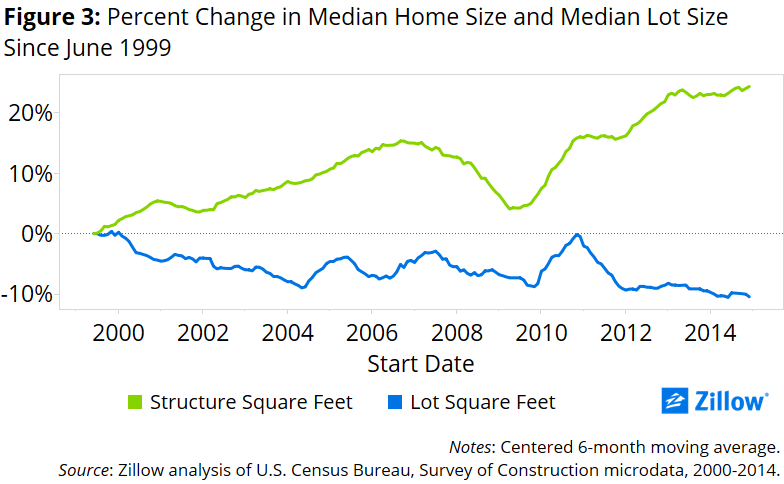
Both larger homes and smaller lots are contributing to the trend, with bigger homes playing a larger role. The median lot size for newly constructed homes has declined about 10 percent from the late 1990s, from about 9,600 square feet to about 8,600 square feet. The median finished square footage of new homes is up almost 25 percent over the same period, from about 2,100 square feet to about 2,600 square feet (figure 3).
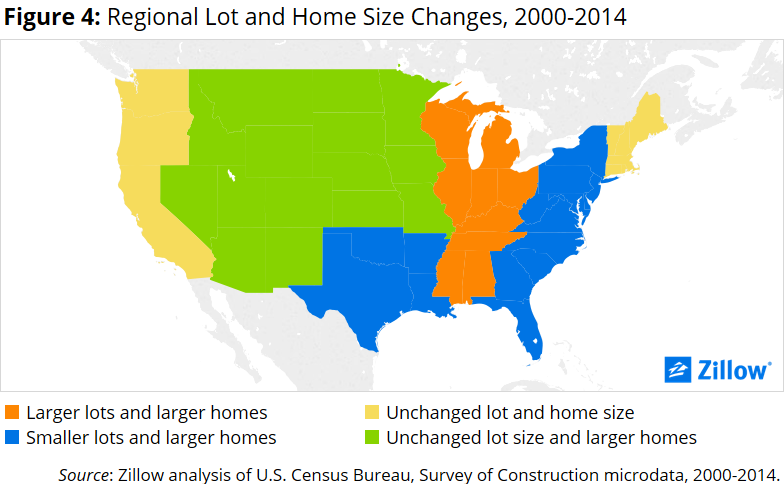
 The trend toward larger homes on smaller (or at least, not appreciably larger) lots is also popping up in unexpected places, namely broad swaths of the Southwest and Great Plains, where one might assume lot sizes would be less constrained by the wide open spaces of the vast middle of the country. Shrinking lots and larger new homes are also common along much of the Eastern Seaboard, from New York south to Florida, which may be more expected given the higher population density along the East Coast. In the states lying between the Appalachian Mountains and the Mississippi River, both homes and lots have gotten larger. In New England and along the West Coast, both lot size and home size have gone largely unchanged (figure 4).
The need for builders to maximize their investments in increasingly expensive land by squeezing more homes onto a given developable tract offers a logical explanation for why lots are getting smaller. But what is making homes themselves larger? More bedrooms and more bathrooms, particularly the latter.
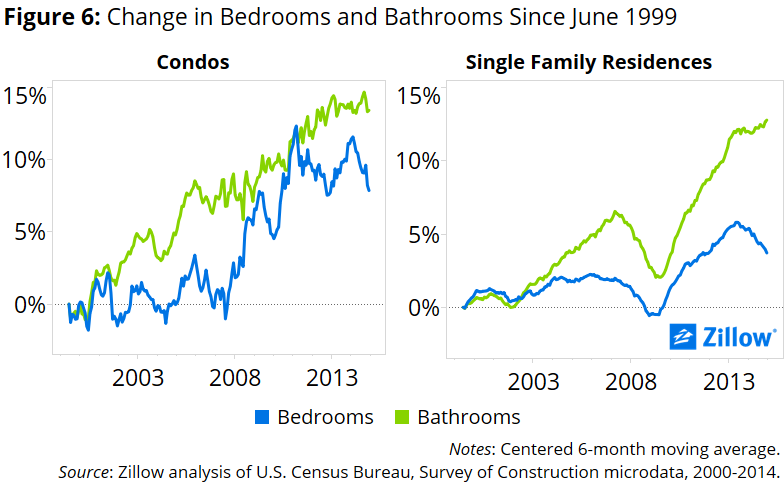
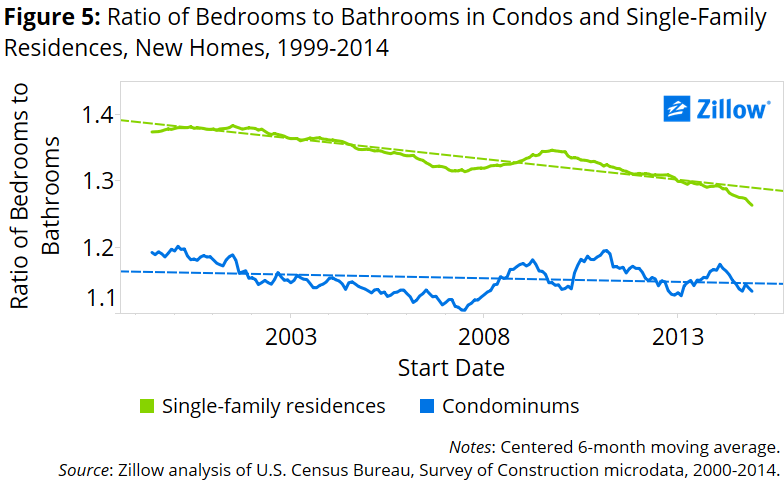 The ratio of bedrooms to bathrooms has been roughly flat for newly constructed condos, but has been trending downward for newly constructed single-family homes (figure 5). The median number of bedrooms in newly constructed condos has increased about 0.3 bedrooms over the past decade and a half, and the median number of bathrooms has increased about 0.3 bathrooms as well (figure 6). Newly constructed single-family homes have 0.1 more bedrooms and 0.3 more bathrooms than they did in 2000.
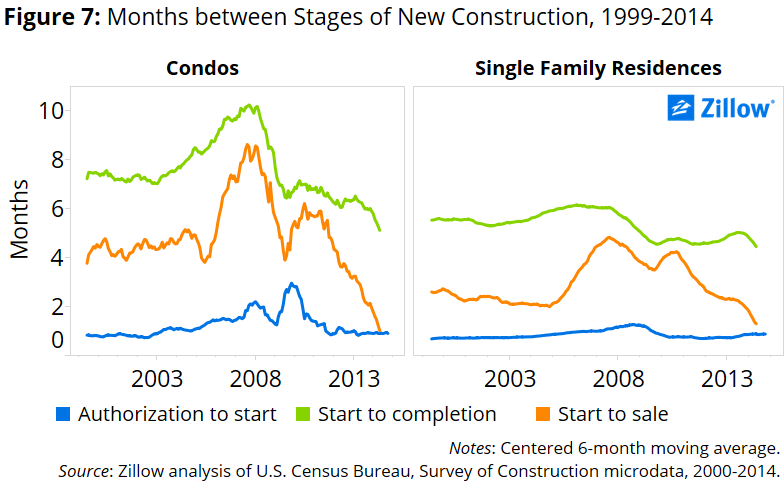
Demand seems high for newly constructed condos and single-family homes. Single-family homes have historically sold more quickly than condos, but this gap has essentially disappeared during the recovery. Both new condos and new single-family homes typically sell about two months after construction begins – in both cases, generally well before the home itself is actually finished getting built.[2] Median construction time for condos has declined from a little more than seven months in the early 2000s to about six months (figure 7), while the time to construct a single-family home has hovered around five months.
Finally, builders also appear to be charging more for this denser new construction. Homes with a higher structure area to lot area tend to have higher prices and a higher margin between the final sale price and the lot price. A 1 percent increase in the ratio between the structure area and the lot area corresponds to a 7.2 percent increase in price (controlling for Census region, condo status and year) and about a 6.6 percent increase in the gap between the final sales price and the lot value.
[1] Zillow analysis of data from the U.S. Census Bureau’s Survey of Construction, 1999-2014.
[2] Sale date is defined as the date that a contract is signed or a deposit is made.
