Birth Rates Dropped Most in Counties Where Home Values Grew Most
A recent decline in fertility was sharpest in counties where home values rose the most, and the change was smaller—and sometimes even up —where home value growth was weaker.

A recent decline in fertility was sharpest in counties where home values rose the most, and the change was smaller—and sometimes even up —where home value growth was weaker.

The economic recovery produced a sharp rise in home prices from 2010 to 2016, and a simultaneous drop in the birth rate. The trends might be related (which is not to say causal), especially for women in their late 20s: Birth rates fell the most in counties where home values grew the most, and birth rates fell less and sometimes even increased in counties with smaller home price increases.
The U.S. baby bust started at the onset of the Great Recession in 2008, when the total fertility rate began falling. It dropped from a high of 2.12 per woman in 2007 to 1.93 by 2010.
Most observers expected that fertility would rebound as the economy recovered, but instead the fertility rate has continued falling. In 2016, the most recent year with detailed birth records, the total fertility rate was down to 1.82, and preliminary data show it dropped to 1.76 in 2017.
A fertility rate of 2.1 births per woman is called the “replacement rate,” because it would maintain the population at a steady level without migration. The long-term effect of total fertility below 2.1 is for the population to steadily decrease.
The dropping birth rate could reflect changing family preferences. But the General Social Survey, which asks Americans, “What do you think is the ideal number of children for a family to have?”, showed a slight increase in the average response to that question, from 2.5 in 2010 to 2.6 in 2016. The Centers for Disease Control and Prevention (CDC)’s National Survey of Family Growth found that women continue to self-report (in 2002, 2010 and 2015) that they expect to have 2.3 children in their lifetimes and men continue to report expecting 2.2 children.
Why might births be dropping? Raising a child is an expensive proposition, so it is little surprise that the most commonly given reason for delaying childbirth in a recent survey was the desire “to be financially established” first, cited by 82 percent of respondents.
Some challenges to financial stability when having a baby include the potential lack of paid parental leave, the cost of child care, and the cost of housing, if families need more space or want to buy a home before having a baby. Housing expenses were the single largest expense category, and the fastest growing, among the costs of child-rearing, according to a 2015 report by the United States Department of Agriculture. Home values have continued to rise since that report was issued, and the cost of housing likely became more daunting for many couples considering a child, especially if they did not already own a house before homes began appreciating so quickly.
The age group most likely to consider having a baby but not already own a home is 25- to 29-year-olds. Between 2010 and 2013, the average age of a first-time home buyer was 32.5, and as homes grew more expensive, that average age rose to 35.2 by 2017. Meanwhile, the average age of mothers at birth rose from 27.7 in 2010 to 28.7 in 2016. For these reasons, this analysis will focus on birth rates for women in their late twenties, which also controls for any changes in counties’ age composition over time.
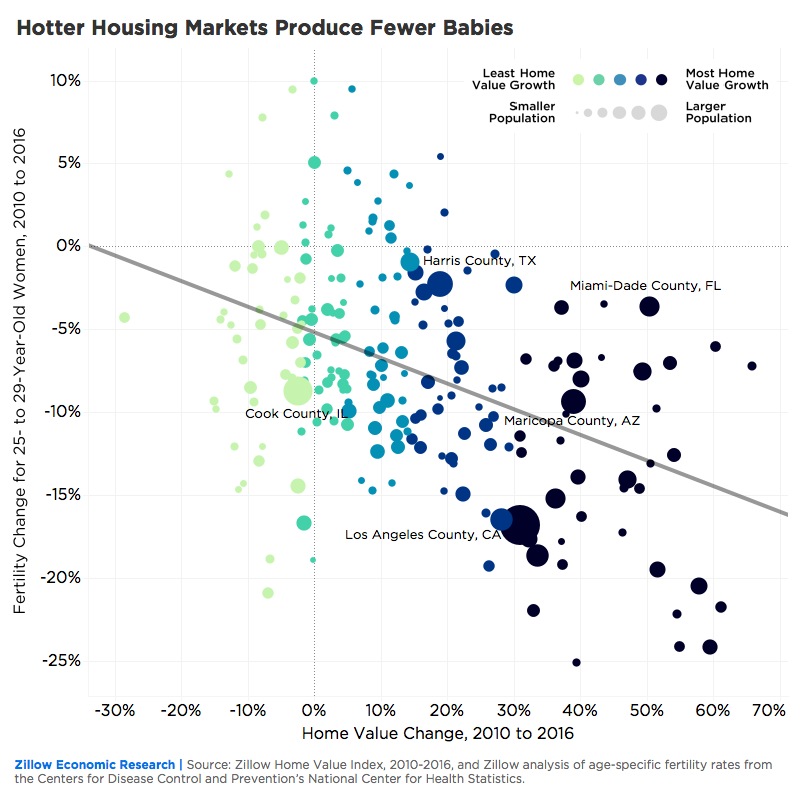
If rising home values contributed to fewer babies being born, we would expect to see that birth rates fell more in places where home values rose more. Birth records from the CDC’s National Center for Health Statistics show that this is, in fact, what happened: There was a strong negative relationship between home value growth and birth rate change across large counties in the U.S. for 25- to 29-year-old women, from 2010 to 2016:

On average, if a county’s home value increase was 10 percentage points higher than another county’s, its fertility rate fell 1.5 percentage points further. For example, Fairfax County, Va., a large county in the suburbs of Washington, D.C., was near average on both dimensions: home values rose 17 percent, and fertility fell 8.2 percent. By comparison, in Monterey County, Calif., outside San Jose, home values rose 37 percent, and fertility fell 11.7 percent, or 3.5 percentage points more than in Fairfax County, similar to the 3.1 percentage point fall predicted by the model.
These results are especially driven by urban counties in the West and Northeast. For instance, Los Angeles County’s birth rate among 25- to 29-year-olds fell 16.8 percent as their home prices rose 31 percent. New York County (Manhattan) had the second biggest fertility decline in the Northeast– 20 percent — and the greatest home price increase in the region — 52 percent. Even after accounting for the effect of home value increases, the West and Northeast still had bigger declines in fertility than the South and Midwest.
Some counties’ fertility changes fall well outside this trend line. The counties where births grew by more than home values predicted they would are in the South and Southwest, as Texas’s booming cities and sunny Southwestern counties bucked the trend despite their rising home values:

Meanwhile, the counties where births fell by even more than the trend in home prices would predict tended to be in large coastal cities or their suburbs, primarily in the West or Northeast:

The negative relationship between the two trends across counties is statistically significant, but clearly there is a great deal of variation in fertility declines unrelated to home values. Large differences from the trend reflect the fact that only 19 percent of the variation in fertility changes can be predicted by home value changes.
As a further caveat, the correlation observed here is by no means proof that home value growth causes fertility declines. One alternative explanation could be the possibility that there is clustering into certain counties of people with careers that pay well enough for expensive homes but make it difficult to have children before 30; this could cause both trends observed in the chart above. There are many other confounding factors that could explain this relationship as well, such as the possibility that cultural values or the cost of child care varies across counties with some correlation to home values.
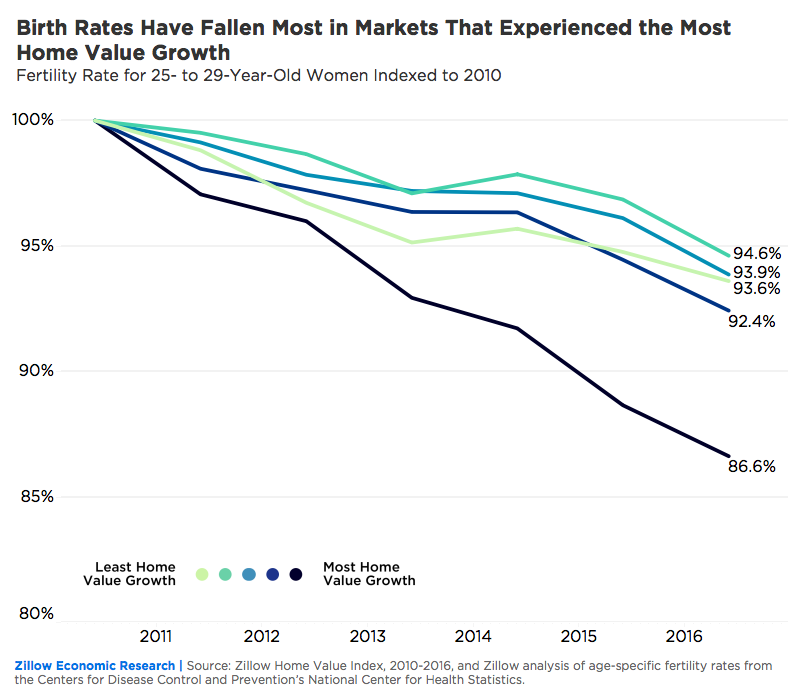
Counties with the largest home value increases had exceptionally large drops in fertility. Those places in the top 20 percent for home value changes saw late-20s fertility drop by about 13 percent from 2010 to 2016, about twice as much as it fell in counties with medium home value growth. And this chart reveals that earlier in the economic recovery, through 2014, it was counties with the highest and the lowest value changes where fertility fell the most:


The big question about post-recession birth rates is whether millennials are simply delaying childbirth or actually reducing the total number of births over their lifetimes compared to previous generations. Birth rates had been rising for women aged 30 and older through 2016, but provisional 2017 data released this May show that the fertility rates for 30- to 39-year old women reversed course last year and dropped for the first time since 2010.
On the other hand, the nationwide homeownership rate rose in 2017 for the first time since 2004, led by under-35 households – which could indicate that their next step is to have children. Meanwhile, the Zillow Home Value Forecast predicts home values will slow the pace of their gains, from the 8.7 percent observed in the last year to 6.5 percent over the next 12 months. It remains to be seen if these changes will help slow or reverse the fertility decline of the past ten years.
Methodology: This analysis relied on the Zillow Home Value Index (ZHVI), and age-specific fertility rates from the Centers for Disease Control and Prevention’s National Center for Health Statistics. Counties with fewer than 10,000 women were excluded from the regression to reduce noise. Several different specifications were tested for robustness and yielded similar results.