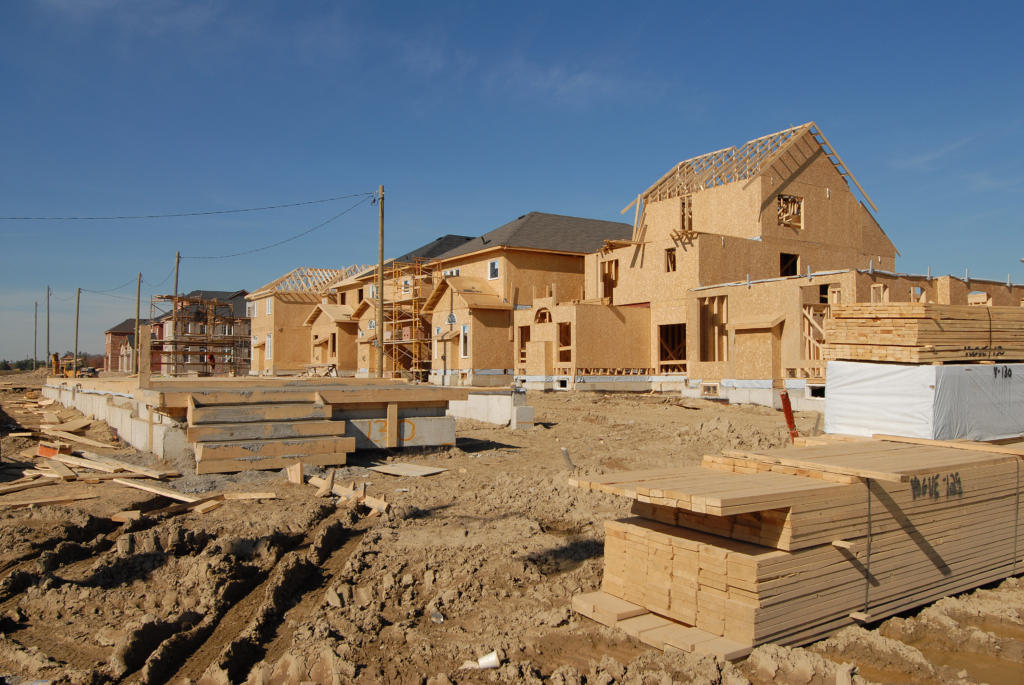
Fewer building restrictions, more housing: Examining builders’ response to demand
As we strive to return stable housing and accessible homeownership to more households, lessons learned from the pandemic demand shock show that more stringent land use regulatory constraints in some markets slowed builders’ efforts to meet rising demand for housing.
Nearly all metropolitan areas in the U.S. saw record-breaking home price appreciation over the first years of the pandemic, between 2020 and mid-2022. But in areas with fewer land use restrictions, builders were able to respond more quickly to the spike in demand. That helped turn around inventory deficits in those metros and reduced price pressure.
Housing supply elasticity is a concept that captures how responsive builders are to changes in prices. In markets, prices grow because consumers buy up goods, giving suppliers an incentive to produce more of them. Housing, however, can in certain regions be slow to respond. It takes time to get housing permitted before a home can go under construction and finally reaches the housing market.
All levels of government, but state and local governments in particular, determine how many homes we can add to the community, what kind, how, where, and how quickly. How many units can be built on a lot, how tall and densely those can be built, as well as parking requirements and permit reviews are a few controls that state and local jurisdictions have that impact building. So in that way, they influence the housing supply elasticity in the local market. Reduce the restrictions, and supply can better respond to demand shocks, easing the long run impact on home prices.
According to research published by the Federal Reserve Board Division of Research and Statistics and Monetary Affairs, regulatory constraints to building – measured by the Wharton Land Use Regulations Index – cause single-family home values to be 9.1% higher and single-family rents to be 4% higher than they would otherwise be.
As the millennial generation entered prime home buying age during the pandemic, lower mortgage rates caused demand for housing to surge. Prices increased and residential construction also soared. According to the US Census Bureau, more than 1.6 million homes were started in 2021, the most of any year since 2006.
Housing supply elasticity — how responsive residential construction is to a change in house prices — varies greatly across the country. When prices go up due to a sudden increase in demand, there is an incentive to build new houses. But how fast and how effectively builders can respond to that summons depends in large part on how constrictive land use and other building regulations are in that location.
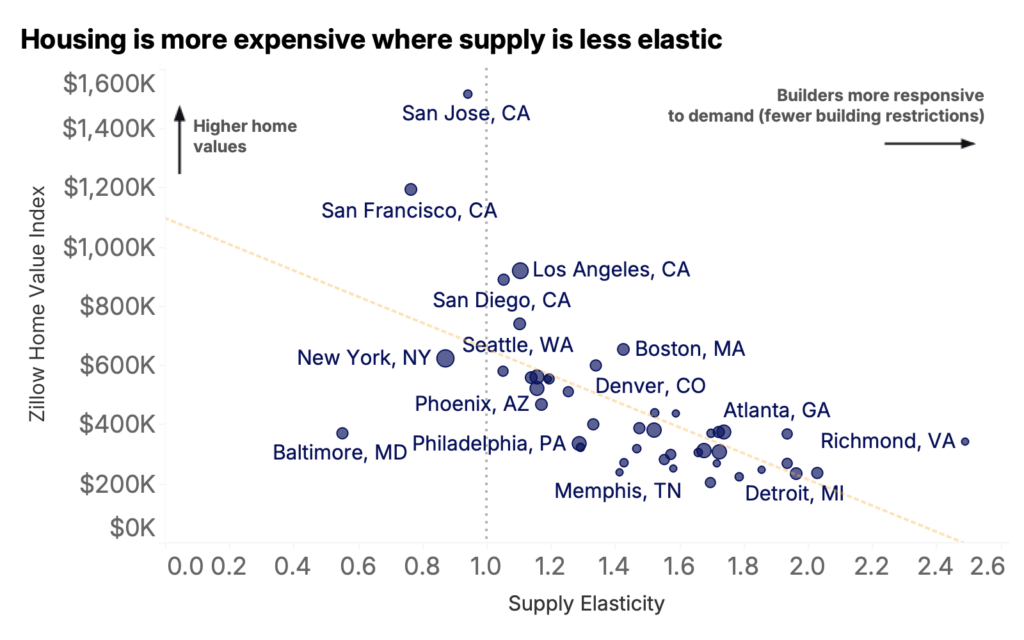
It matters a great deal for housing affordability. The new supply of houses is expected to moderate price growth. The less elastic supply is, the higher prices rise and housing affordability deteriorates as a result.
In order to estimate the responsiveness of new construction to changes in prices and how the degree of the local rules and regulations plays a role, we use a sample of some of the largest metropolitan areas. Using our estimates for how building permits change in response to prices, we decompose permitting activity into the impact of an increase due to housing demand and that of factors unrelated to the surge in market activity.
Among the top 50 metros, metros that saw the largest builder response relative to what would be expected due to market conditions were Pittsburgh, San Antonio, Phoenix, Dallas, Columbus, Austin, Charlotte, Memphis, Indianapolis and Sacramento.
The metros where builders underbuilt the most relative to what was expected from the pandemic demand surge were Seattle, Baltimore, Detroit, Orlando, Washington DC, Boston, San Francisco, Portland, Miami, and Salt Lake City. Seattle issued 27% fewer single-family building permits than were needed to keep up with the pandemic increase in housing demand. Permitting fell short by 26% and 23% in Baltimore, Detroit respectively. The shortfall was roughly 20% in Boston and 18% in San Francisco.
Before the pandemic, a 1% increase in real home prices was associated with a 1.7% increase in single-family building permits on average. However, how much supply responds to prices varies across metros partly because land use and building restrictions can dampen the effect of rising home values on new construction.
On one hand, rising home values raise the incentive to build. On the other, more restrictive localities tend to approve fewer building permits. Severe density restrictions, minimum lot size requirements but also permit approval delays, and discretionary review – a deterrent to even current-code compliant projects – all raise costs for builders and lower the number of new construction projects.
Among the largest 50 metro areas, Richmond VA has the loosest regulations while Baltimore MD has the strictest building rules. Adopting the local standards prevalent in the Richmond metropolitan area would spur a new construction boom in all large metropolitan areas.
APPENDIX
A. The methodology
Similarly to Aastveit, K A, B Albuquerque and A Anundsen (2020), we estimate the following specification:
![]()
Where log(PERMITSi,t) denotes the log of building permits, log(ZHVIi,t) is the log of the Zillow Home Value Index deflated by CPI, WRLURI is the Wharton Land Use Regulatory Index, X’ i,t is a vector of local variables, including local CPI, the dependency ratio (the number of people aged 0–14 and 65 and above relative to the total population), and the fraction of Blacks and Hispanics in the population. We add MSA-fixed effects ηi and time-fixed effects ζt.
We expect to be positive since permits are expected to increase when prices increase. We expect to be negative since stricter regulations are expected to limit how much new construction can respond to home price growth. The implied supply elasticity for a given market is found by differentiating the model equation with respect to house prices:
![]()
Since higher prices affect housing supply while supply also impacts house prices, we address the issue of reverse causality by using an instrumental variable approach with an instrument for real house prices – real income – that shifts housing demand but doesn’t affect supply directly. A valid instrument I for home values in the housing supply equation needs to shift housing demand (and thereby home values), while at the same time be orthogonal to omitted supply factors. The traditional IV conditions for all i and t need to be satisfied:
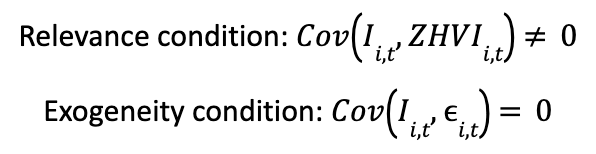
Income is one of the main determinants of housing and consumption demand that does not affect housing supply directly.
B. The Results
Inflation adjusted incomes explain 53% of the variation in real home values making it a valid instrument for predicting home values. A 1% increase in real income is associated with approximately a 1.5% increase in real house prices. A 1% increase in home prices (instrumented with incomes to capture just the pull from demand) corresponds with a 1.7% increase in building permits, holding all else constant. The severity of land use regulations affect how responsive building permits are to a demand shock that raises home values. In regions with stricter land use restrictions, the effect of rising home values on building permits is dampened. The negative coefficient on building restrictions δ<0 indicates that in areas with stricter land-use regulations (higher WRLURI), the effect of home prices on building permits is reduced. This makes sense: stricter regulations limit the ability of new construction to respond to rising home prices.
| MSA | % increase in building permits for every 1% increase in home values | % change in ZHVI from 2019-12 to 2022-12 | Actual number of building permits issued in 2021 and 2022 | Expected permitting response to demand in 2021 and 2022 | Actual permits above(+)/below (-) expectations (%) |
| Pittsburgh | 1.70 | 25.1% | 4,560 | 3,419 | 33.4% |
| San Antonio | 1.57 | 40.5% | 24,000 | 19,441 | 23.4% |
| Phoenix | 1.17 | 57.0% | 60,926 | 50,915 | 19.7% |
| Dallas | 1.52 | 47.7% | 91,460 | 76,979 | 18.8 % |
| Columbus | 1.66 | 39.6% | 12,202 | 10,465 | 16.6% |
| Austin | 1.26 | 59.6% | 44,140 | 37,951 | 16.3% |
| Charlotte | 1.93 | 54.8% | 37,799 | 33,663 | 12.3% |
| Memphis | 1.42 | 46.9% | 7,808 | 7,053 | 10.7% |
| Indianapolis | 1.43 | 45.5% | 18,315 | 16,781 | 9.1% |
| Sacramento | 1.05 | 33.0% | 17,307 | 15,900 | 8.9% |
| MSA | % increase in building permits for every 1% increase in home values | % change in ZHVI from 2019-12 to 2022-12 | Actual number of building permits issued in 2021 and 2022 | Expected permitting response to demand in 2021 and 2022 | Actual permits above(+)/below (-) expectations (%) |
| Seattle | 1.10 | 40.6% | 15,601 | 21,466 | -27.3% |
| Baltimore | 0.55 | 23.0% | 7,711 | 10,351 | -25.5% |
| Detroit | 1.96 | 29.8% | 10,248 | 13,343 | -23.2% |
| Orlando | 1.33 | 51.5% | 33,482 | 41,981 | -20.3% |
| Washington DC | 1.16 | 24.6% | 24,621 | 30,860 | -20.2% |
| Boston | 1.42 | 30.4% | 9,288 | 11,610 | -20.0% |
| San Francisco | 0.76 | 24.3% | 7,374 | 9,227 | -17.9% |
| Portland | 1.19 | 32.0% | 13,949 | 16,778 | -16.9% |
| Miami | 1.16 | 51.9% | 14,780 | 17,388 | -15.0% |
| Salt Lake City | 1.19 | 47.8% | 9,162 | 10,719 | -14.5% |
[1] We estimate how building permits respond to changes in house prices, after controlling for local economic conditions, regulatory constraints measured by the Wharton Regulatory Land Use Regulations Index (WRLURI) and other MSA specific demographic variables. The sample includes 30 of the 50 largest metro areas for which we have building permit data and WRLURI scores observed monthly from 2014-2019 – before the pandemic shock.
[2] Omitting 2020 from the model due to pandemic-related issues with census estimates.
