Buyers: Results from the Zillow Consumer Housing Trends Report 2024

In this section, we provide a high-level overview of key buyer information and what their homes look like. According to the Census Bureau American Community Survey (ACS), 5% of adults in the country are recent buyers. Throughout this section, information about buyers comes from CHTR, and information about other groups comes from ZG Population Science analyzes using ACS data.
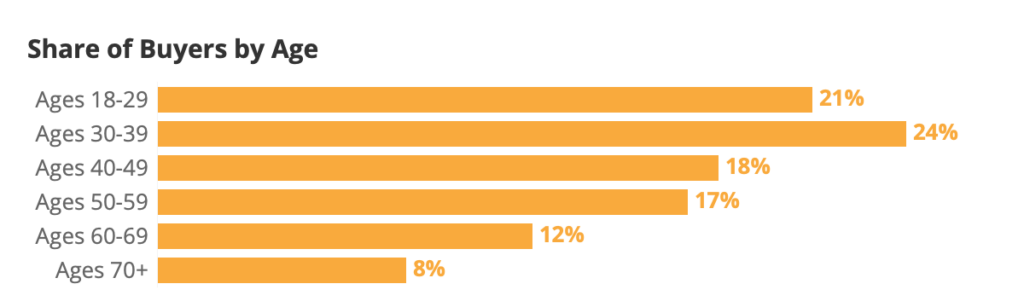
The median age of U.S. buyers is 42, while the average skews higher (44 years old). About one in five buyers (21%) are in their twenties or younger and roughly a fifth (20%) are in their sixties or older.
| Age Group | Successful Buyers | Household Decision Makers | US Adults |
| Ages 18-29 | 21% | 12% | 20% |
| Ages 30-39 | 24% | 17% | 18% |
| Ages 40-49 | 18% | 16% | 16% |
| Ages 50-59 | 17% | 17% | 16% |
| Ages 60-69 | 12% | 18% | 15% |
| Ages 70+ | 8% | 19% | 15% |
Source: Household decision maker and US adult estimates from Census Bureau, 2023 Current Population Survey Annual Social and Economic Supplement
Consistent with age, the largest generational group of buyers is between 30 and 44 years old in 2024 — the group colloquially known as “Millennials.” About 34% of buyers are Millennials.
| Generation | Buyers | Household Decision Makers | US Adults |
| Gen Z (18-29) | 21% | 12% | 20% |
| Millennial (30-44) | 34% | 26% | 26% |
| Gen X (45-59) | 25% | 25% | 23% |
| Baby Boomer (60-79) | 19% | 31% | 26% |
| Silent Generation (80+) | 1% | 6% | 5% |
Source: Household decision maker and US adult estimates from Census Bureau, 2023 Current Population Survey Annual Social and Economic Supplement
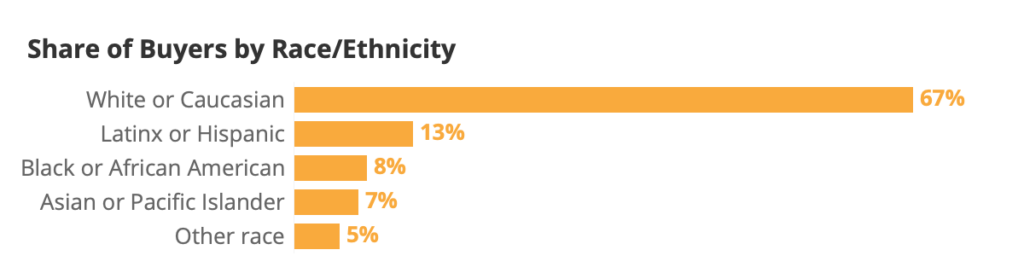
About two thirds of buyers are non-Hispanic white or Caucasian (67%), higher than the overall share of the U.S. adult population that is white (60%). At the same time, 17% of U.S. adults identify as non-Hispanic Black or African American, but just 8% of buyers are Black.
| Race & Ethnicity | Buyers | Household Decision Makers | US Adults |
| White or Caucasian | 67% | 63% | 60% |
| Latinx or Hispanic | 13% | 12% | 12% |
| Black or African American | 8% | 15% | 17% |
| Asian or Pacific Islander | 7% | 5% | 6% |
| Other race | 5% | 4% | 5% |
Source: Household decision maker and US adult estimates from Census Bureau, 2022 American Community Survey
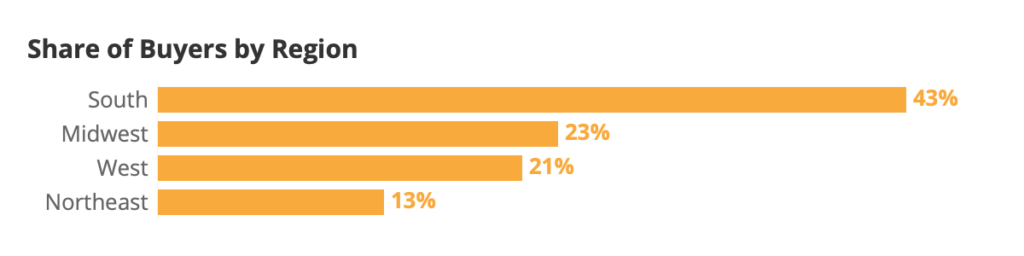
The largest share of buyers live in the South (43%), followed by the Midwest (23%) and West (21%). The smallest share lives in the Northeast (13%). Buyers largely follow the distribution of US adults, with a higher concentration in the South – the region with the most home construction and inventory.
The table below also compares this distribution of buyers by region with the distribution of for-sale inventory that we see on our site. Consistent with the graph above, the South has the most for-sale inventory, while the Northeast has the least.
| Region | Buyers | Household Decision Makers | US Adults | For Sale Housing Inventory | Inventory (Field Period) |
| South | 43% | 39% | 39% | 55% | 54% |
| West | 21% | 22% | 24% | 20% | 19% |
| Midwest | 23% | 21% | 20% | 15% | 15% |
| Northeast | 13% | 17% | 17% | 10% | 12% |
Source: Household decision maker and US adult estimates from Census Bureau, 2023 Current Population Survey Annual Social and Economic Supplement
Share of For Sale Housing Inventory comes from Zillow’s listings data as of July 11th, 2024.
Approximately 11% of buyers identified as LGBTQ+ in 2024.
The percentage of buyers identifying as LGBTQ+ has been relatively stable over the last few years. About one in fourteen (7%) buyers identified as LGBTQ+ in 2019, the first year CHTR asked about sexual orientation and gender identity, then 9% in 2020 and in 2023. This likely represents the growing share of younger buyers, who may be more likely to feel comfortable self-identifying as LGBTQ+.
| Buyers that identified as LGBTQ+ | 2019 | 2020 | 2021 | 2022 | 2023 | 2024 |
| 7% | 9% | 12% | 10% | 9% | 11% |
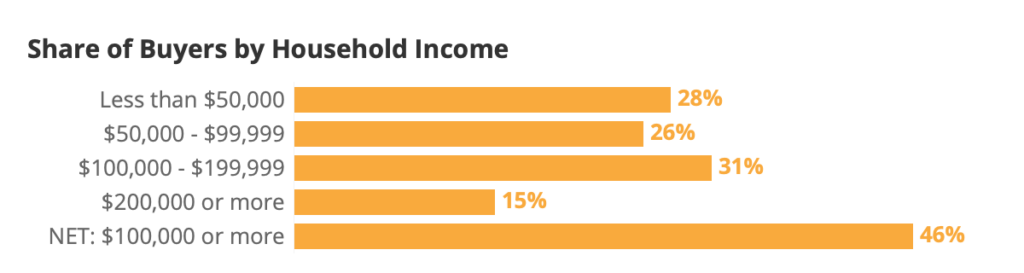
Unsurprisingly, buyers tend to have higher household incomes than the U.S. population overall. The annual median household income among buyers is approximately $97,600, compared to the overall national median of $74,600.
| Annual Household Income | Buyer Households | All US Households |
| Less than $50,000 | 28% | 34% |
| $50,000 – $99,999 | 26% | 29% |
| $100,000 – $199,999 | 31% | 26% |
| $200,000 or more | 15% | 12% |
| NET: $100,000 or more | 46% | 37% |
Source: All US household estimates from Census Bureau, 2023 Current Population Survey Annual Social and Economic Supplement
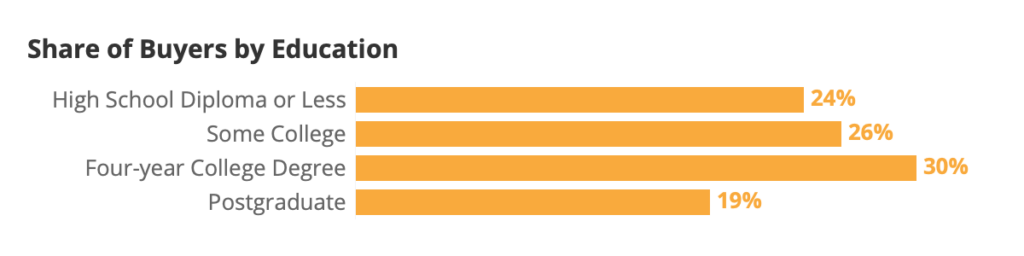
Buyers tend to be more educated than the overall population of U.S. adults: 49% of buyers have at least a four-year degree, higher than 35% of overall U.S. adults.
| Education | Buyers | Household Decision Makers | US Adults |
| High School Diploma or Less | 24% | 35% | 39% |
| Some College | 26% | 27% | 26% |
| Four-year College Degree | 30% | 24% | 22% |
| Postgraduate | 19% | 14% | 13% |
Source: All household estimates from Census Bureau, 2023 Current Population Survey Annual Social and Economic Supplement
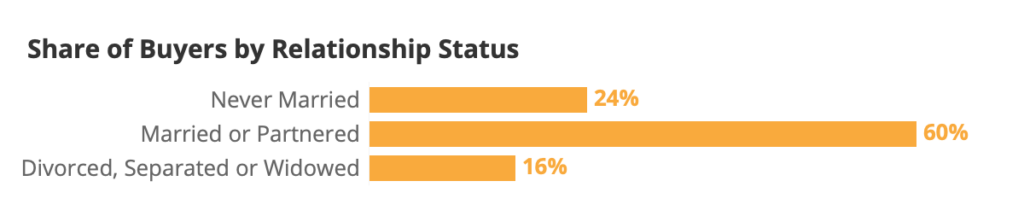
Prior research has shown that the purchase of a home is often tied to family formation or other life events, like a divorce or separation. This relationship between homeownership and family formation helps explain why over two thirds of buyers are married/partnered (70%) and almost a sixth (15%) have been married in the past.
| Relationship Status | Buyers | Household Decision Makers | Household Heads | US Adults |
| Never Married | 24% | 18% | 20% | 28% |
| Married or Partnered | 60% | 59% | 56% | 55% |
| Divorced, Separated or Widowed | 16% | 23% | 24% | 17% |
Source: All household estimates from Census Bureau, 2023 Current Population Survey Annual Social and Economic Supplement
Buyer households are more likely to report having at least one pet (76%) than a child (43%). Dogs are the most common pet among buyer households (64% report having at least one) followed by cats (42%).
| In Household | Buyer Households | Tenured Homeowner Households | All Households | |
| Children under 18 | 36% | 44% | 43% | |
| Plant | 62% | – | – | |
| Dog | 64% | 46% | 38% | |
| Cat | 42% | 34% | 22% | |
| Another pet | 12% | 10% | 10% | |
| NET: Any pet | 76% | 61% | 50% | |
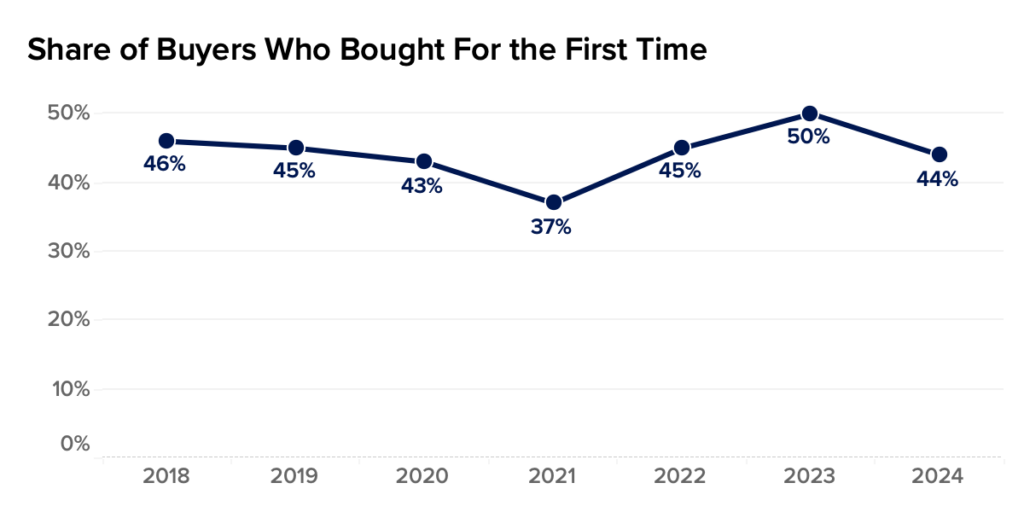
In 2024, the share of buyers who reported purchasing for the first time fell to 44% from its 2023 peak of 50%.
| Share of Buyers that Bought For the First Time | ||||||
| 2018 | 2019 | 2020 | 2021 | 2022 | 2023 | 2024 |
| 46% | 45% | 43% | 37% | 45% | 50% | 44% |
Most buyers (63%) purchase and share ownership of their home with at least one other person. Half of buyers (52%) cobought with a partner or spouse. Cobuying with a relative (9%) and/or friend (7%) was less common.
| Cobought with | Feb- April 2022 | Dec 2022 | 2023 | 2024 |
| Spouse/partner | 45% | 60% | 50% | 52% |
| Friend | 10% | 4% | 14% | 7% |
| Relative | 11% | 6% | 12% | 9% |
| NET: Friend/relative | 18% | 8% | 21% | 15% |
| Any cobuy | 58% | 65% | 62% | 63% |
| Did not cobuy | 42% | 35% | 38% | 37% |
Most married or partnered buyers cobuy (80%) and three quarters of married/partnered buyers (74%) purchase with a spouse or partner. Buyers who are single and never married are most likely to cobuy with a friend or relative (24%, versus 15% of divorced/separated/widowed and 11% of married/partnered buyers).
| Among cobuyers, reasons for cobuying | 2022 | 2023 | 2024 | ||||||||
| More affordable than buying on my own | 34% | 44% | 36% | I do not want to live alone | 18% | 19% | 23% | Easier to get approved for a mortgage | 39% | 46% | 39% |
Unpartnered co-buyers were more likely to cite affordability (47%) and not wanting to live alone (27%) than married/partnered co-buyers (33% and 22%).
| Among cobuyers, reasons for cobuying | Total | Never married, divorced, separated, or widowed | Married, partnered |
| More affordable than buying on my own | 36% | 47% | 33% |
| I do not want to live alone | 23% | 27% | 22% |
| Easier to get approved for a mortgage | 39% | 39% | 39% |
About two thirds of buyers (66%) say their final offer was contingent on the property passing a home inspection. And half (56%) said the same about successfully receiving financing (e.g. mortgage approval). Contingency on the property appraising at a minimum amount was similarly common (52%). A mortgage rate buydown – where the seller agrees to buy down the buyer’s interest rate – was the least common: About a quarter of buyers 24% said they won such a concession in their final offer.
| Share of buyers that report including each contingency in their final offer | 2022 | 2023 | 2024 |
| Financing | 61% | 61% | 56% |
| Appraisal | 59% | 58% | 52% |
| Inspection | 70% | 67% | 66% |
| Sale of my previous home recoded | 29% | 26% | 23% |
| Mortgage buydown |
|
32% | 24% |
| At least 1 contingency | 85% | 82% | 82% |
| Financed home purchase with | 2018 | 2019 | 2020 | 2021 | 2022 | 2023 | 2024 |
| Mortgage/home loan | 77% | 70% | 72% | 75%* | 79% | 76% | 70% |
| Cash – paid in full | 23% | 30% | 28% | 25%* | 21% | 24% | 30% |
* From Zillow Analysis of US Census Bureau American Community Survey (ACS) 2021
Almost all mortgage buyers (94%) reported getting pre-approved for financing. Under half of cash buyers (43%) also reported getting pre-approved, despite ultimately buying their home free and clear.
The typical buyer gets one lender pre-approval. About a third (32%) get pre-approved by 2 or more lenders.
While most cash buyers forego pre-approvals (57% don’t get any), many get pre-approved before ultimately purchasing without a mortgage.
| Pre-approvals | Total Buyers | Mortgage | Cash |
| 0 lenders pre-approved me for a mortgage | 24% | 6% | 57% |
| 1 lenders pre-approved | 45% | 56% | 23% |
| 2 lenders pre-approved | 19% | 23% | 11% |
| 3 lenders pre-approved | 9% | 12% | 5% |
| 4 lenders pre-approved | 2% | 3% | 2% |
| 5 or more lenders pre-approved | 1% | 1% | 1% |
| Net: 2 or more | 32% | 38% | 19% |
Among buyers that got two or more lenders to pre-approve them, the most common reasons for getting multiple pre-approvals were finding a different lender that offered a better rate (36%) and wanting a diverse mix of pre-approvals (34%).
| Reasons for multiple pre-approvals among buyers that got pre-approved by 2+ lenders | First-time buyer | Repeat buyer | |
| Found a different lender that offered a better rate | 36% | 45% | 30% |
| Wanted a diverse mix of pre-approvals (e.g. big bank, online bank, credit union, etc) | 34% | 39% | 30% |
| Lender offered a benefit like reduced fees or rate lock if I got a pre-approval with them | 25% | 27% | 24% |
| Home seller wanted to see pre-approvals from multiple lenders | 19% | 18% | 20% |
| Found a different lender that offered better customer service | 19% | 21% | 17% |
Most mortgage buyers submit only one mortgage application (62%).
| Mortgage applications | Mortgage Buyers | First-time buyer | Repeat buyer |
| 1 mortgage application | 62% | 65% | 61% |
| 2 mortgage applications | 24% | 22% | 26% |
| 3 mortgage applications | 10% | 10% | 10% |
| 4 mortgage applications | 2% | 1% | 2% |
| 5 or more applications | 1% | 1% | 1% |
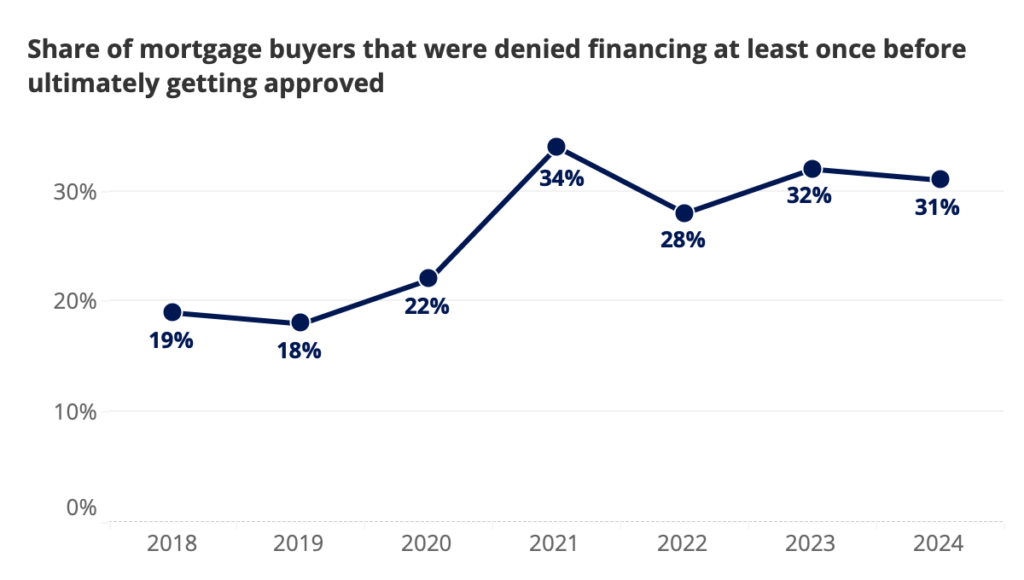
Consistent with previous years, about a third of mortgage buyers (31%) say they were denied financing at least once before ultimately getting approved. For comparison, according to Home Mortgage Disclosure Act (HMDA) data from 2022, only 9% of mortgage applicants were denied.
Higher self-reported mortgage denials could suggest that survey participants mis-report challenges, discouragement, poor customer service, or other hurdles to securing home financing as denials. The divergence between self-report denials and HMDA denials cuts both ways; buyers appear to over-report denials in surveys, but HMDA does not capture cases where an application drops out of the process for reasons beyond an official denial, often before ever applying.
| Mortgage buyers that report at least one mortgage denial before ultimately getting approved | ||||||
| 2018 | 2019 | 2020 | 2021 | 2022 | 2023 | 2024 |
| 19% | 18% | 22% | 34% | 28% | 32% | 31% |
About half (48%) of mortgage buyers reported putting down less than 20% on the home they purchased – with the median mortgage buyer putting down 20% of the final purchase price.
| Percent down | 2018 | 2019 | 2020 | 2021 | 2022 | 2023 | 2024 |
| Less than 3% | 11% | 11% | 9% | 10% | 12% | 8% | 7% |
| 3% to 5% | 15% | 18% | 14% | 12% | 16% | 14% | 11% |
| 6% to 9% | 9% | 9% | 11% | 14% | 9% | 8% | 8% |
| 10% to 19% | 21% | 22% | 23% | 25% | 21% | 18% | 22% |
| 20% | 24% | 20% | 20% | 21% | 20% | 23% | 28% |
| Between 21% and 99% | 21% | 21% | 20% | 18% | 21% | 29% | 24% |
| NET: Less than 20% | 55% | 60% | 56% | 61% | 58% | 48% | 48% |
| NET: 20% or more | 45% | 40% | 40% | 39% | 42% | 52% | 52% |
The most common source of down payment funding comes from savings (72%), followed by proceeds from a previous home sale (46%).
| Sources Mortgage Buyers Used to Finance their Down Payment | 2018 | 2019 | 2020 | 2021 | 2022 | 2023 | 2024 |
| Saved it up over time | 70% | 66% | 67% | 67% | 63% | 75% | 72% |
| From the sale of my previous home | 39% | 37% | 44% | 59% | 46% | 46% | 46% |
| Gift(s) from family and/or friends | 30% | 26% | 34% | 35% | 27% | 39% | 31% |
| Loan(s) from family and/or friends | 26% | 24% | 30% | 33% | 23% | 33% | 28% |
| I used my retirement fund | 27% | 24% | 29% | 35% | 23% | 32% | 24% |
| Sold stocks or other investments | 26% | 24% | 31% | 38% | 27% | 35% | 29% |
| Other | 12% | 14% | 13% | 28% | 22% | 23% | 23% |
| NET: Gift/loan from family/friends | 37% | 34% | 40% | 42% | 30% | 43% | 38% |
| Used 2 or more sources | 46% | 43% | 47% | 57% | 42% | 57% | 54% |
Savings comprise the largest share (41%) of the average down payment – about $30,000 on the typical market-rate US home (assuming a 20% down payment). For mortgage buyers that also sell a previous residence, though, proceeds from their previous home sale pull ahead (46% of the average down payment versus only 27% savings).
About one in five (20%) mortgage buyers taps their retirement to fund their down payment. However, the average down payment is only 6% retirement savings – about $4,000. The trend is similar with gifts or loans from friends and family – about a third (30%) of buyers report using some kind of help, but it composes only 13% of the average down payment (about $9,000).
| Average Mortgage Buyer Down Payment Composition | 2018 | 2019 | 2020 | 2021 | 2022 | 2023 | 2024 |
| Saved it up over time | 41% | 39% | 37% | 32% | 37% | 40% | 41% |
| From the sale of my previous home | 22% | 22% | 22% | 28% | 27% | 21% | 25% |
| Gift(s) from family and/or friends | 8% | 9% | 10% | 6% | 7% | 8% | 7% |
| Loan(s) from family and/or friends | 7% | 6% | 6% | 7% | 4% | 8% | 6% |
| I used my retirement fund | 8% | 7% | 9% | 7% | 7% | 8% | 6% |
| Sold stocks or other investments | 7% | 8% | 8% | 9% | 7% | 8% | 7% |
| Other | 7% | 9% | 7% | 10% | 11% | 7% | 8% |
| NET: Gift/loan from family/friends | 15% | 15% | 17% | 13% | 11% | 16% | 13% |
Despite relatively high rates over the past year, nearly half of mortgage buyers (45%) say their current mortgage rate is lower than 5%. When asked how they secured a rate lower than the “market standard”, the most common explanation was that the seller or home builder offered them home financing at a special rate (35%). Other explanations included making their offer contingent on a rate buydown (26%), refinancing to a lower rate after buying (25%), and borrowing from someone they knew personally (like friends or family) (23%).
| Buyers with a rate below 5% that cite each reason for their low rate | |
| Refinanced to a lower rate after buying | 25% |
| Borrowed from someone I know personally (e.g. friends, family) | 23% |
| Bought points to lower my rate | 23% |
| My offer was contingent on a rate buydown from the seller/builder | 26% |
| The seller/builder financed my home purchase at a special rate | 35% |
| Net: Any of the above | 81% |
| Net: None of the above | 19% |
Only about a fifth (19%) of mortgage buyers with a sub-5%-rate did not cite one of the five reasons we asked about as a reason. That share falls further (to 10%) for those who did not finance with an adjustable rate mortgage (ARM), down payment assistance, or a loan term shorter than 30 years
Mortgage buyers that report including projected rental income on their mortgage application are more likely to say that their mortgage rate is below 5% (60% versus 37% for mortgage buyers that did not include projected rental income on their mortgage application).
| Projected rental income on mortgage app | |||
| Rate | Mortgage Buyers | Included | Not included |
| <2% | 2% | 5% | 1% |
| 2% – 2.99% | 4% | 6% | 4% |
| 3% – 3.99% | 16% | 21% | 14% |
| 4% – 4.99% | 22% | 28% | 19% |
| 5% – 5.99% | 20% | 23% | 19% |
| 6% – 6.99% | 24% | 10% | 30% |
| 7%+ | 12% | 7% | 14% |
| NET: <5% | 45% | 60% | 37% |
| NET: 5%+ | 55% | 40% | 63% |
Mortgage rates below 5% are more common for mortgage buyers that get down payment assistance (63%), an adjustable rate mortgage (57%), and a loan term shorter than 30 years (65%) compared to mortgage buyers overall (45%).
| Rate | Mortgage Buyers | Down payment assistance | ARM | <30-year term | Projected rental income |
| <2% | 2% | 4% | 4% | 2% | 3% |
| 2% – 2.99% | 4% | 6% | 4% | 7% | 6% |
| 3% – 3.99% | 16% | 24% | 21% | 23% | 22% |
| 4% – 4.99% | 22% | 29% | 28% | 33% | 28% |
| 5% – 5.99% | 20% | 19% | 22% | 21% | 20% |
| 6% – 6.99% | 24% | 12% | 16% | 10% | 14% |
| 7%+ | 12% | 6% | 6% | 5% | 7% |
| NET: <5% | 45% | 63% | 57% | 65% | 59% |
| NET: 5%+ | 55% | 37% | 43% | 35% | 41% |
Two thirds (67%) of mortgage buyers that get down payment assistance, an ARM, a loan term shorter than 30 years, AND include projected rental income on their mortgage application are significantly more likely to have a rate below 5%.
| Rate | All of the above | Any of the above | None of the above |
| <2% | 1% | 3% | 1% |
| 2% – 2.99% | 4% | 6% | 2% |
| 3% – 3.99% | 29% | 22% | 7% |
| 4% – 4.99% | 33% | 28% | 12% |
| 5% – 5.99% | 25% | 20% | 21% |
| 6% – 6.99% | 7% | 14% | 38% |
| 7%+ | 1% | 7% | 19% |
| NET: <5% | 67% | 59% | 22% |
| NET: 5%+ | 33% | 41% | 78% |
About three quarters of mortgage buyers with a sub-5% rate reported getting at least one grant (70%) or forgivable/low-interest loan (74%) toward their down payment. For comparison, those with a rate of at least 5% were about half as likely to report such grants (37%) or loans (38%).
First-time buyers that finance with a mortgage are more likely to report getting down payment assistance (60%) than their repeat buyer counterparts (43%).
| Reported each type of down payment assistance | Mortgage Buyers | First-time buyer | Repeat buyer |
| Grant(s) – Funds I do not have to repay | 14% | 17% | 11% |
| Low-interest loan(s) | 31% | 35% | 27% |
| Forgivable loan(s) | 19% | 19% | 19% |
| Any | 52% | 60% | 43% |
| None | 48% | 40% | 57% |
Mortgage buyers of color were more likely to report receiving grants (17%) and low-interest loans (34%) than mortgage buyers overall (14% and 31%). Buyers of color are more likely to be first-time buyers – sometimes a requirement to qualify for certain programs.
Securing at least one type of down payment assistance was more common for mortgage buyers of color (58%) than for the population overall (52%).
| Reported each type of down payment assistance | Mortgage Buyers | White | Black | Hispanic | Nonwhite |
| Grant(s) | 14% | 13% | 18% | 20% | 17% |
| Low-interest loan(s) | 31% | 30% | 35% | 37% | 34% |
| Forgivable loan(s) | 19% | 19% | 19% | 28% | 21% |
| Any | 52% | 49% | 63% | 69% | 58% |
| None | 48% | 51% | 37% | 31% | 42% |
The share of mortgage buyers that report receiving any down payment assistance grew from just over a third (37%) in 2022 to half (52%) in 2024. Banks appear to be the leading driver of this growth – increasingly connecting buyers to down payment assistance or offering it themselves. About a quarter of mortgage buyers reported getting down payment assistance from a bank in 2022 (24%) – reaching about a third (33%) in 2024.
| Mortgage buyers reported getting down payment assistance from each source | December 2022 | 2024 |
| Bank | 24% | 33% |
| Credit Union | 14% | 17% |
| Nonprofit | 4% | 8% |
| Government | 13% | 12% |
| Other | 2% | 3% |
| At least one | 37% | 52% |
| None | 63% | 48% |
Almost all buyers (91%) said that they did not fully expect to pay at least one cost or fee, out of the five we asked about. The most common unexpected fee was a loan origination (66%).
| Fees/costs that buyers did not fully expect to pay when they started the homebuying process | Total Buyers | First-time buyers | Repeat buyers |
| Loan origination fee | 66% | 73% | 60% |
| Appraisal costs | 54% | 59% | 50% |
| State/local title transfer taxes | 54% | 62% | 47% |
| Title insurance or title search fee | 51% | 60% | 43% |
| Closing costs/closing fee | 38% | 44% | 33% |
| Any | 91% | 90% | 92% |
| None | 9% | 10% | 8% |
| Fees/costs that buyers did not fully expect to pay when they started the homebuying process | Total Buyers | Mortgage buyers | Cash buyers |
| Loan origination fee | 66% | 83% | 59% |
| Appraisal costs | 54% | 63% | 50% |
| State/local title transfer taxes | 54% | 54% | 54% |
| Title insurance or title search fee | 51% | 54% | 50% |
| Closing costs/closing fee | 38% | 44% | 35% |
| Any | 91% | 87% | 93% |
| None | 9% | 13% | 7% |
Closing and appraisal costs (both 23%) were most commonly considered the “most unexpected surprise” when closing
| “Most unexpected surprise expense” when closing on their home among buyers that did not fully expect or understand all costs/fees | |
| Closing costs/closing fee | 23% |
| Appraisal costs | 23% |
| State/local title transfer taxes | 19% |
| Title insurance or title search fee | 18% |
| Loan origination fee | 17% |
About two in five buyers (42%) said that the final costs of closing on their home were more than they expected. About a quarter (24%) reported that the costs came in below their expectations, and a third (34%) said they were exactly what they expected.
First-time buyers were more likely to say that their final closing costs were more than they expected (49%, versus 37% for repeat buyers).
| Final closing costs were | Total Buyers | First-time | Repeat |
| Less than expected | 24% | 26% | 22% |
| Exactly as expected | 34% | 26% | 41% |
| More than expected | 42% | 49% | 37% |
About two thirds of pre-approved buyers (65%) reported using a real estate website or app when looking at financing options. Two in five also said they used a referral from a real estate agent, realtor, or broker (61%). Other common resources included a search engine (59%), and the buyer’s current financial institution (54%).
| Resources buyers used when looking at financing options | Total | Mortgage Buyers | Pre-Approved Buyers |
| Real estate website / app (e.g. Zillow, RE/MAX, Realtor.com) | 58% | 62% | 65% |
| Referral from real estate agent, realtor, or broker | 55% | 60% | 61% |
| Search engine (e.g. Google, Bing) | 53% | 55% | 59% |
| My current financial institution (online / in-person) | 49% | 54% | 54% |
| Another financial institution (online / in-person) | 36% | 40% | 42% |
| Referral from friend, relative, neighbor or colleague | 42% | 44% | 45% |
| Social networking website / app (e.g. Facebook, NextDoor, Twitter, Instagram) | 37% | 37% | 39% |
| Financial website / app (e.g. LendingTree, Quicken Loans, Bankrate.com) | 34% | 40% | 40% |
| Home builder / new home sales center | 32% | 34% | 37% |
| Direct mail (e.g. newsletter, flyer, postcard) | 21% | 21% | 23% |
| Newspaper ad | 18% | 18% | 20% |
About one in five buyers that finance with a mortgage said they first found the lender they used from a referral from a real estate agent, realtor, or broker (19%). A slightly smaller share say they first found them from a real estate website or app (16%), and one in ten (10%) say a referral from a friend, relative, neighbor, or colleague.
| Where mortgage buyers first found/heard about financial provider | Mortgage Buyers | Pre- approved |
| Referral from real estate agent, realtor, or broker | 19% | 19% |
| Real estate website / app (e.g. Zillow, RE/MAX, Realtor.com) | 16% | 17% |
| Referral from friend, relative, neighbor or colleague | 9% | 9% |
| Past experience with this provider | 9% | 9% |
| Home builder / new home sales center | 9% | 8% |
| My current financial institution (online / in-person) | 7% | 7% |
| Another financial institution (online / in-person) | 1% | 1% |
| Search engine (e.g. Google, Bing) | 6% | 6% |
| Social networking website / app (e.g. Facebook, NextDoor, Twitter, Instagram) | 5% | 4% |
| Know them from my community | 4% | 3% |
| Financial website / app (e.g. LendingTree, Quicken Loans, Bankrate.com) | 4% | 4% |
| Attended an open house and met provider | 3% | 3% |
| Saw contact information on For Sale/Open House sign | 2% | 2% |
| TV/Radio Ad | 1% | 1% |
| Direct mail (e.g. newsletter, flyer, postcard) | 1% | 1% |
| Newspaper ad | 0% | 0% |
| Other | 4% | 4% |
Among mortgage buyers, first-time buyers are more likely to find their lender from a referral from a friend, relative, neighbor or colleague (12% versus 7% for repeat buyers). Repeat buyers are unsurprisingly more likely to reference past experience with their lender (13% versus 4% for first-timers).
| Where mortgage buyers first found/heard about financial provider | First-time | Repeat |
| Referral from real estate agent, realtor, or broker | 17% | 20% |
| Real estate website / app (e.g. Zillow, RE/MAX, Realtor.com) | 18% | 15% |
| Referral from friend, relative, neighbor or colleague | 12% | 7% |
| Past experience with this provider | 4% | 13% |
| Home builder / new home sales center | 9% | 8% |
| My current financial institution (online / in-person) | 7% | 8% |
| Another financial institution (online / in-person) | 2% | 1% |
| Search engine (e.g. Google, Bing) | 7% | 4% |
| Social networking website / app (e.g. Facebook, NextDoor, Twitter, Instagram) | 3% | 6% |
| Know them from my community | 6% | 3% |
| Financial website / app (e.g. LendingTree, Quicken Loans, Bankrate.com) | 4% | 4% |
| Attended an open house and met provider | 4% | 2% |
| Saw contact information on For Sale/Open House sign | 1% | 3% |
| TV/Radio Ad | 2% | 1% |
| Direct mail (e.g. newsletter, flyer, postcard) | 0% | 1% |
| Newspaper ad | 0% | 0% |
| Other | 4% | 5% |
The typical mortgage buyer hired the first lender they contacted. About two in five cash buyers (42%) also reported contacting at least one lender before ultimately purchasing their home without a mortgage.
| Lenders contacted | Total Buyers | Mortgage | Cash |
| 0 lenders contacted | 23% | 58% | |
| 1 lender contacted | 55% | 56% | 21% |
| 2 lenders contacted | 25% | 25% | 10% |
| 3 lenders contacted | 15% | 15% | 7% |
| 4 lenders contacted | 2% | 1% | 2% |
| 5 or more | 2% | 2% | 1% |
| Among buyers that contacted a lender | Total | First-Time Buyer | Repeat Buyer |
| 1 lender contacted | 55% | 54% | 57% |
| 2 lenders contacted | 25% | 25% | 25% |
| 3 lenders contacted | 15% | 18% | 13% |
| 4 lenders contacted | 2% | 1% | 3% |
| 5 or more | 2% | 2% | 2% |
Just over half of mortgage buyers report communicating with their lender weekly (54%). About a third (32%) said they communicated daily. Communicating every couple weeks (12%) and monthly or less (3%) were less common.
Just over half of buyers that financed with a mortgage ranked “lender offers the lowest rate” (56%) among their top two most important considerations when choosing a lender. Closer to two in five (41%) said the same about the lender being a prompt communicator, guaranteeing that they will close on time (39%), and being recommended by their real estate agent (39%).
| Ranked among top 2 most important considerations when choosing a lender | Mortgage buyers | First- Time | Repeat |
| Lender offers the lowest rate | 56% | 59% | 61% |
| Lender is a prompt communicator | 41% | 48% | 44% |
| Guarantee that they will close on time | 39% | 46% | 49% |
| Recommended by my real estate agent, realtor, or broker | 39% | 40% | 47% |
| Recommended by a friend or family member | 25% | 26% | 33% |
Almost all buyers (94%) used at least one online shopping resource (website, mobile, app) when looking for a home to buy.
Majorities of buyers have used a website on a computer, a mobile website, and a mobile app to search for a home in recent years. Rates at which buyers report using each have increased over time.
| Online resources used when searching | 2019 | 2020 | 2021 | 2022 | 2023 | 2024 |
| Website on a laptop / desktop computer | 73% | 76% | 82% | 80% | 82% | 80% |
| Mobile website on a smartphone / tablet | 60% | 64% | 74% | 75% | 84% | 80% |
| App on a smartphone / tablet | 51% | 55% | 68% | 68% | 77% | 72% |
About half (50%) of buyers (and 56% of buyers that used an agent) say that their agent was the most helpful resource in their home buying experience. About a third (36%) said a real estate app or website was their most helpful resource (21% about a mobile site or app and 15% about a website on a laptop or desktop computer). About one in six (15%) said advice from family or friends was their most helpful resource.
| Mortgage buyers used when looking for financing options | 2019 | 2020 | 2021 | 2022 | 2023 | 2024 |
| Real estate website / app (e.g. Zillow, RE/MAX, Realtor.com) | 33% | 36% | 40% | 49% | 66% | 62% |
| Search engine (e.g. Google, Bing) | 36% | 37% | 41% | 37% | 58% | 55% |
| Financial website / app (e.g. LendingTree, Quicken Loans, Bankrate.com) | 31% | 35% | 38% | 32% | 49% | 40% |
| Social networking website / app (e.g. Facebook, NextDoor, Twitter, Instagram) | – | – | 31% | 26% | 38% | 37% |
| My current financial institution | 46% | 50% | 54% | 42% | 55% | 54% |
| Another financial institution | 36% | 39% | 38% | 40% | 48% | 40% |
| Referral from real estate agent or broker | 49% | 52% | 57% | 54% | 66% | 60% |
| Referral from friend, relative, neighbor or colleague | 33% | 40% | 41% | 41% | 47% | 44% |
| Newspaper ad | 18% | 22% | 20% | 16% | 22% | 18% |
| Direct mail (e.g. newsletter, flyer, postcard) | 18% | 23% | 25% | 17% | 25% | 21% |
| Resource | 2018 | 2019 | 2020 | 2021 | 2022 | 2023 | 2024 |
| Referral from a real estate agent, realtor, or broker | 24% | 23% | 23% | 23% | 25% | 19% | 19% |
| Referral from friend, relative, neighbor or colleague | 11% | 13% | 12% | 9% | 10% | 10% | 9% |
| Net: Referral | 35% | 36% | 35% | 32% | 34% | 29% | 28% |
| Real estate website / app (e.g. Zillow, Realtor.com, Redfin) | 6% | 6% | 8% | 8% | 10% | 16% | 16% |
| Financial website / app (e.g. LendingTree, Quicken Loans) | 6% | 2% | 5% | 5% | 4% | 7% | 4% |
| Search engine (e.g. Google, Bing) | 5% | 6% | 5% | 6% | 6% | 5% | 6% |
| Social networking website / app (e.g. Facebook, NextDoor, Twitter, Instagram) | 3% | 3% | 4% | 5% | 3% | 4% | 5% |
| Net: Online | 20% | 17% | 22% | 24% | 23% | 33% | 30% |
| Home builder / new home sales center | – | – | – | – | – | – | 9% |
| Past experience with this provider | 17% | 16% | 14% | 17% | 10% | 9% | 9% |
| My current financial institution | – | – | – | – | 8% | 9% | 7% |
| Another financial institution | – | – | – | – | 1% | 2% | 1% |
| Know them from my community | 7% | 7% | 5% | 5% | 5% | 4% | 4% |
| Saw contact information on For Sale/open house sign | 3% | 3% | 4% | 4% | 2% | 4% | 2% |
| Direct mail (e.g. newsletter, flier, postcard) | 2% | 3% | 3% | 1% | 1% | 2% | 1% |
| TV/radio | – | – | 2% | 3% | 1% | 2% | 1% |
| Attended an open house and met provider | 3% | 4% | 3% | 4% | 3% | 1% | 3% |
| Newspaper ad | 2% | 3% | 3% | 1% | <1% | 1% | <1% |
| Other | 6% | 6% | 5% | 5% | 7% | 4% | 5% |
Majorities of buyers surveyed in 2024 continue to agree at least somewhat with a series of statements on their desire for floor plans. While buyers continue to agree that they’re more likely to view a home if the listing includes a floor plan they like (86%), they are also likely to agree that the only way to really understand the layout of a home is to see it in person (80%). The high agreement with both statements likely shows that most buyers want all the information they can get when searching for a home: Floor plans to help decide which homes to tour and an in-person visit for the homes with floor plans that fit their preferences.
| Share that agree somewhat/completely with each statement | 2020 | 2021 | 2022 | 2023 | 2024 |
| I wasted time during my home search viewing properties that I would have skipped if I had understood their floor plan before my visit | 54% | 56% | 50% | 52% | 50% |
| I’m more likely to view a home if the listing includes a floor plan that I like | 79% | 81% | 80% | 82% | 86% |
| The only way to really understand the layout of a home is to see it in person | 76% | 78% | 76% | 81% | 80% |
| A dynamic floor plan that shows what part of the home each photo depicts would help me determine if the home is right for me | 71% | 74% | 69% | 76% | 77% |
Buyers surveyed in 2024 remained likely to agree somewhat or completely with most statements on their preference for 3D and virtual tours. This year, however, saw a drop in the share that agreed with the statement “I prefer 3D tours over in-person viewings” — falling to 27% from its historic peak of 40% last year.
| Share of buyers that agree somewhat/completely with each statement | 2019 | 2020 | 2021 | 2022 | 2023 | 2024 |
| 3D tours would help me get a better feel for the space than static photos | 52% | 62% | 68% | 66% | 72% | 70% |
| I wish more listings had 3D tours available | 46% | 55% | 61% | 61% | 67% | 62% |
| I prefer 3D tours over in-person viewings | 26% | 35% | 38% | 32% | 40% | 27% |
| I prefer to schedule in-person tours online | – | 57% | 61% | 62% | 66% | 64% |
| It would be easier for me to unlock properties with my phone and tour them in-person on my own time | – | 59% | 63% | 64% | 68% | 67% |
Buyers in their 30s and 40s were the most likely to agree that they prefer 3D over in-person tours: 38% of buyers in their 30s and 43% of those in their 40s agreed at least somewhat. These age groups were also more likely to agree with other statements, like wishing that more listings had 3D tours available (both 70%) and preferring to schedule in-person tours online (70% and 67%).
| Share of buyers that agree somewhat/completely with each statement | 18-29 | 30s | 40s | 50s | 60+ |
| 3D tours would help me get a better feel for the space than static photos | 70% | 72% | 76% | 70% | 62% |
| I wish more listings had 3D tours available | 68% | 70% | 70% | 57% | 42% |
| I prefer 3D tours over in-person viewings | 21% | 38% | 43% | 22% | 14% |
| I prefer to schedule in-person tours online | 73% | 70% | 67% | 58% | 52% |
| It would be easier for me to unlock properties with my phone and tour them in-person on my own time | 72% | 71% | 76% | 67% | 48% |
Consistent with the fall in the share of buyers that said they prefer virtual tours over in-person viewings, buyers surveyed in 2024 were also less likely to say they felt very or extremely confident making an offer on a home where they saw a 360/virtual tour, but did not view in person. Almost two in five (37%) reported high confidence in 2023, falling to about a quarter (23%) this year.
About half (49%) of buyers said they would be at least somewhat confident making an offer on a home after seeing a 360/virtual tour, but not an in-person viewing – the lowest since we started asking in 2020.
| Buyer confidence making an offer on a home where they saw a 360/virtual tour, but did not view the home in person | 2020 | 2021 | 2022 | 2023 | 2024 |
| Very/Extremely Confident | 32% | 34% | 31% | 37% | 23% |
| Somewhat Confident | 23% | 25% | 23% | 24% | 26% |
| Net: At least somewhat confident | 55% | 58% | 54% | 61% | 49% |
| Not at all/Not very Confident | 45% | 42% | 46% | 39% | 51% |
About a quarter of buyers (28%) say that they made at least one offer on a home before viewing the home in person. For most of these sight-unseen offers, though, a friend/colleague (6%), relative (19%), real estate agent (36%), or spouse/partner (42%) viewed the home before making the offer. All in all, only 4% of buyers made an offer without any of the above viewing the home in-person first.
| Made an offer without viewing the home in person | 2023 | 2024 |
| Any unseen offer | 37% | 28% |
| Spouse/partner visited, unseen for buyer | 19% | 12% |
| Friend/relative visited, unseen for buyer & spouse/partner | 8% | 5% |
| Agent visited, unseen for buyer, spouse/partner & friend/relative | 6% | 7% |
| Made offer completely unseen | 4% | 4% |
The largest shares of buyers say that a home having air conditioning (83%) and being within their initial budget (79%) are very or extremely important home characteristics.
| Consider Each Home Characteristic Very or Extremely Important | 2018 | 2019 | 2020 | 2021 | 2022 (Winter) | 2023 | 2024 |
| Had air conditioning | 76% | 78% | 79% | 84% | 79% | 84% | 83% |
| Was within my initial budget | 83% | 83% | 82% | 84% | 81% | 84% | 79% |
| Had preferred number of bedrooms | 78% | 76% | 77% | 78% | – | 78% | 73% |
| Preferred size / square footage | 69% | 67% | 69% | 70% | – | 73% | 70% |
| Had private outdoor space (e.g. patio, deck, yard) | 70% | 67% | 72% | 71% | 68% | 73% | 70% |
| Had a floor plan / layout that fit my preferences | 68% | 67% | 72% | 73% | – | 72% | 69% |
| Good potential to increase in value | 67% | 64% | 67% | 71% | 74% | 73% | 68% |
| Preferred utilities (e.g. gas, electric) | 61% | 62% | 67% | 66% | – | 68% | 67% |
| Had preferred number of bathrooms | 70% | 67% | 72% | 74% | – | 73% | 66% |
| Had ample storage | 64% | 64% | 68% | 75% | 71% | 71% | 65% |
| Offered off-street parking or a garage | 70% | 64% | 68% | 73% | – | 71% | 65% |
| Had an en-suite or master bathroom | 62% | 60% | 64% | 69% | – | 69% | 65% |
| Was energy efficient | 56% | 56% | 62% | 67% | 63% | 64% | 60% |
| Had a spare or guest bedroom | 60% | 59% | 63% | 66% | – | 68% | 60% |
| Had my preferred style of kitchen | 58% | 57% | 63% | 63% | – | 64% | 57% |
| Had my preferred finishes (e.g. flooring, countertops, appliances) | 53% | 52% | 58% | 58% | – | 59% | 55% |
| Offered me my own assigned parking place | – | 58% | 62% | 62% | – | 64% | 55% |
| Had “smart home” capabilities (e.g. with lighting, heating, and electronic devices that can be controlled remotely by smartphone or computer) | 27% | 27% | 35% | 40% | 40% | 42% | 36% |
| Offered shared community amenities (e.g. clubhouse, fitness center, playground) | 29% | 31% | 37% | 37% | 34% | 43% | 36% |
| Opportunity to rent out entire home in the future to produce rental income | 27% | 28% | 33% | 34% | – | 43% | 32% |
| Had a hot tub or pool | 24% | 25% | 30% | 35% | 36% | 40% | 29% |
| Opportunity to rent out a portion of the home for rental income while living in the home | 24% | 24% | 31% | 31% | – | 39% | 28% |
About three in five buyers (62%) considered a walkable neighborhood as very or extremely important. A sense of community or belonging (55%) and proximity to shopping, services and/or leisure activities (54%) followed.
| Very or Extremely Important
Neighborhood Characteristics |
2018 | 2019 | 2020 | 2021 | 2023 | 2024 |
| In a walkable neighborhood | 58% | 60% | 66% | 64% | 67% | 62% |
| Offered a sense of community or belonging | 47% | 48% | 51% | 54% | 56% | 55% |
| Close to shopping, services, and/or leisure activities | 54% | 53% | 58% | 56% | 60% | 54% |
| My commute to work or school | 54% | 52% | 53% | 51% | 53% | 51% |
| Close to family and/or friends | 47% | 46% | 50% | 50% | 57% | 48% |
| Close to public transportation | 30% | 30% | 36% | 36% | 43% | 34% |
Of the climate and disaster resiliency characteristics we asked about, buyers were most likely to say that water-tight windows, doors and roofs were very or extremely important (72%). Wind-resistant doors and windows (61%), fireproof/noncombustible home materials (59%) and an overall “climate-proof” home (57%) followed.
| Climate/Disaster Resiliency Characteristic Importance | At least | |
| Very important | Somewhat important | |
| Water-tight windows, doors and roofs | 72% | 93% |
| Wind-resistant doors and windows | 61% | 85% |
| Fireproof/noncombustible home materials | 59% | 83% |
| Home is “climate-proof” | 57% | 84% |
| Hurricane-resistant siding | 46% | 67% |
| Storm-proof shutters | 45% | 67% |
| Wildfire-resistant plants/landscaping | 44% | 67% |
| At least one of the above | 86% | 96% |
| All of the above | 22% | 49% |
About three quarters (73%) of buyers said that at least one climate risk impacted where they shopped for a home. Buyers were most likely to say that they only considered homes in low flood-risk areas (43%). About a quarter of buyers said that they avoid homes that are prone to wildfires (28%), climates with extreme temperatures (26%), and only considered homes where hurricanes are uncommon (25%).
| Climate risks impacted where buyer shopped for a home | Total | Gen Z (Ages 18-29) | Millennial (Ages 30-44) | Gen X (Ages 45-59) | Boomers + Silent Gen (60+) |
| Flood | 43% | 44% | 40% | 39% | 50% |
| Hurricane | 25% | 28% | 25% | 24% | 22% |
| Wildfires | 28% | 32% | 28% | 26% | 26% |
| Drought | 23% | 27% | 28% | 17% | 18% |
| Extreme temperatures | 26% | 32% | 28% | 23% | 21% |
| Other | 2% | 2% | 2% | 2% | 5% |
| At least one climate risk | 73% | 83% | 75% | 67% | 64% |
| None | 27% | 17% | 25% | 33% | 36% |
| Impacted where buyer shopped for a home | Total | 18-29 | 30-39 | 40-49 | 50-59 | 60+ |
| Flood | 43% | 44% | 39% | 39% | 41% | 50% |
| Hurricane | 25% | 28% | 24% | 26% | 24% | 22% |
| Wildfires | 28% | 32% | 26% | 33% | 24% | 26% |
| Drought | 23% | 27% | 28% | 27% | 12% | 18% |
| Extreme temperatures | 26% | 32% | 25% | 31% | 21% | 21% |
| Other | 2% | 2% | 2% | 1% | 3% | 5% |
| At least one climate risk | 73% | 83% | 74% | 74% | 66% | 64% |
| None | 27% | 17% | 26% | 26% | 34% | 36% |
| Impacted where buyers shopped for a home | Total | Midwest | Northeast | South | West |
| Flood | 43% | 47% | 44% | 44% | 34% |
| Hurricane | 25% | 26% | 29% | 23% | 24% |
| Wildfires | 28% | 25% | 30% | 27% | 32% |
| Drought | 23% | 28% | 29% | 19% | 23% |
| Extreme temperatures | 26% | 25% | 35% | 20% | 34% |
| Other | 2% | 2% | 2% | 3% | 2% |
| At least one climate risk | 73% | 72% | 75% | 73% | 73% |
| None | 27% | 28% | 25% | 27% | 27% |
| Impact of climate risks on where buyers shopped for a home | Total | Gen Z (Ages 18-29) | Millennial (Ages 30-44) | Gen X (Ages 45-59) | Boomers + Silent Gen (60+) |
| Extremely impactful | 17% | 15% | 23% | 16% | 10% |
| Very impactful | 17% | 18% | 18% | 17% | 13% |
| Somewhat impactful | 29% | 32% | 24% | 29% | 32% |
| Not very impactful | 20% | 25% | 15% | 20% | 21% |
| Not at all impactful | 18% | 10% | 19% | 18% | 23% |
| NET: Very/extremely impactful | 34% | 33% | 41% | 33% | 23% |
| NET: Not at all/not very impactful | 38% | 35% | 35% | 38% | 45% |
| Climate risks are | Total | 18-29 | 30-39 | 40-49 | 50-59 | 60+ |
| Extremely impactful | 17% | 15% | 24% | 21% | 13% | 10% |
| Very impactful | 17% | 18% | 18% | 16% | 18% | 13% |
| Somewhat impactful | 29% | 32% | 22% | 29% | 30% | 32% |
| Not very impactful | 20% | 25% | 16% | 16% | 20% | 21% |
| Not at all impactful | 18% | 10% | 20% | 17% | 19% | 23% |
| NET: Very/extremely impactful | 34% | 33% | 41% | 38% | 31% | 23% |
| NET: Not at all/not very impactful | 38% | 35% | 36% | 33% | 39% | 45% |
| Climate risks are | Total | Midwest | Northeast | South | West |
| Extremely impactful | 17% | 18% | 20% | 14% | 21% |
| Very impactful | 17% | 10% | 18% | 19% | 17% |
| Somewhat impactful | 29% | 28% | 19% | 31% | 31% |
| Not very impactful | 20% | 23% | 22% | 19% | 17% |
| Not at all impactful | 18% | 21% | 22% | 16% | 13% |
| NET: Very/extremely impactful | 34% | 28% | 37% | 34% | 38% |
| NET: Not at all/not very impactful | 38% | 44% | 44% | 35% | 31% |
| Compared to where they lived previously, buyers moved to places with | Total | Gen Z (Ages 18-29) | Millennial (Ages 30-44) | Gen X (Ages 45-59) | Boomers + Silent Gen (60+) |
| Fewer climate risks | 30% | 23% | 32% | 35% | 29% |
| More climate risks | 15% | 17% | 18% | 13% | 8% |
| The same climate risks | 55% | 60% | 50% | 52% | 62% |
| Moved to places with | Total | 18-29 | 30-39 | 40-49 | 50-59 | 60+ |
| Fewer climate risks | 30% | 23% | 31% | 32% | 37% | 29% |
| More climate risks | 15% | 17% | 19% | 16% | 11% | 8% |
| The same climate risks | 55% | 60% | 50% | 52% | 52% | 62% |
To gain a comprehensive understanding of the US homebuyers, Zillow Group Population Science conducted a nationally representative survey – collecting over 54,500 responses (approximately 18,500 from successful buyers and 36,000 from prospective buyers). The survey contains information from approximately 12,000 unique successful buyers and 23,500 unique prospective buyers. The study was fielded between March and September 2024.
Wherever possible, survey questions from previous years were asked in the same manner this year to allow for the measurement of year-to-year trends in key areas of interest.
For the purpose of this study, “successful buyers” – typically shortened to “buyers” refers to household decision makers 18 years of age or older who moved to a new primary residence that they purchased in the past two years. A majority of buyers in this sample (58% unweighted; 55% weighted) purchased within the past year.
Results from this survey are nationally representative of successful buyers. US adult decision makers were identified from online nonprobability samples. To achieve representativeness, we used a combination of quota sampling and statistical raking using benchmarks estimated from the 2022 American Community Survey (ACS) and the 2023 Current Population Survey Annual and Economic Supplement (CPS ASEC).
To ensure that this weighting procedure did not drive observed results, we created several alternative sets of weights for key estimates of interest. These alternative weights included several versions with additional population characteristics– especially those that could be correlated with estimates of interest– from external sources, as well as propensity matching to better capture a given respondent’s underlying probability of participating in the survey. None of the alternative sets of weights substantively shifted the estimates examined.
To reduce response bias, survey respondents did not know that Zillow Group was conducting the survey. Several additional quality control measures were also taken to ensure data accuracy:
