Buyers: Results from the Zillow Consumer Housing Trends Report 2025

In this section, we provide a high-level overview of key buyer information and what their homes look like. According to the Census Bureau American Community Survey (ACS), 5% of adults in the country are recent buyers. Throughout this section, information about buyers comes from CHTR, and information about other groups comes from ZG Population Science analyzes using ACS data.
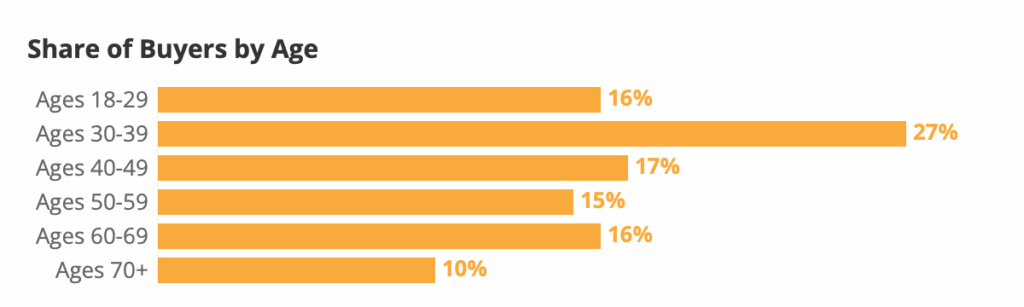
The median age of U.S. buyers is 42, while the average skews higher (44 years old). About one in five buyers (21%) are in their twenties or younger and roughly a fifth (20%) are in their sixties or older.
| Age Group | Successful Buyers | Household Decision Makers | US Adults |
| Ages 18-29 | 16% | 11% | 20% |
| Ages 30-39 | 27% | 18% | 18% |
| Ages 40-49 | 17% | 17% | 16% |
| Ages 50-59 | 15% | 17% | 16% |
| Ages 60-69 | 16% | 18% | 16% |
| Ages 70+ | 10% | 20% | 15% |
Source: Household decision maker and US adult estimates from Census Bureau, 2024 Current Population Survey Annual Social and Economic Supplement
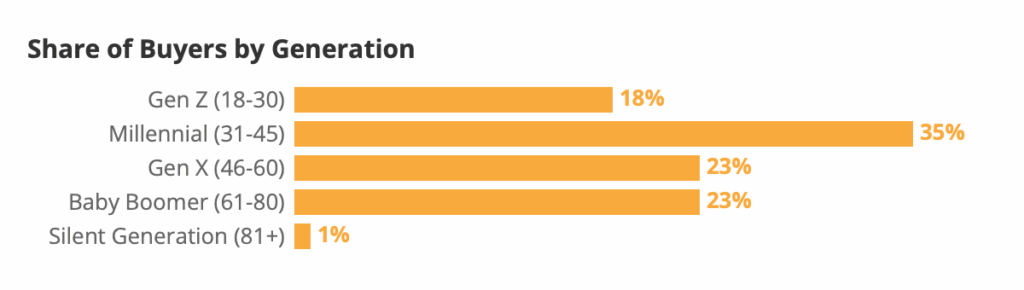
| Generation1 | Buyers | Household Decision Makers | US Adults |
| Gen Z (18-30) | 18% | 11% | 20% |
| Millennial (31-45) | 35% | 26% | 26% |
| Gen X (46-60) | 23% | 25% | 23% |
| Baby Boomer (61-80) | 23% | 31% | 26% |
| Silent Generation (81+) | 1% | 7% | 5% |
Source: Household decision maker and US adult estimates from Census Bureau, 2024 Current Population Survey Annual Social and Economic Supplement
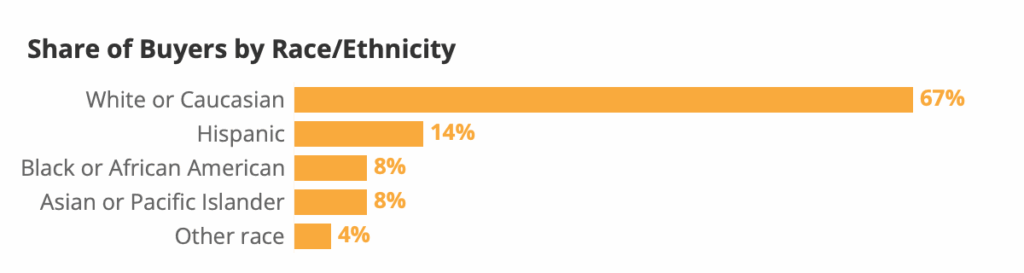
About two thirds of buyers are non-Hispanic white or Caucasian (66%), higher than the overall share of the U.S. adult population that is white (60%). At the same time, 18% of U.S. adults identify as non-Hispanic Black or African American, but just 9% of buyers are Black.
| Race & Ethnicity | Buyers | Household Decision Makers | US Adults |
| White or Caucasian | 67% | 63% | 60% |
| Hispanic | 14% | 12% | 12% |
| Black or African American | 8% | 15% | 18% |
| Asian or Pacific Islander | 8% | 6% | 6% |
| Other race | 4% | 4% | 5% |
Source: Household decision maker and US adult estimates from Census Bureau, 2023 American Community Survey
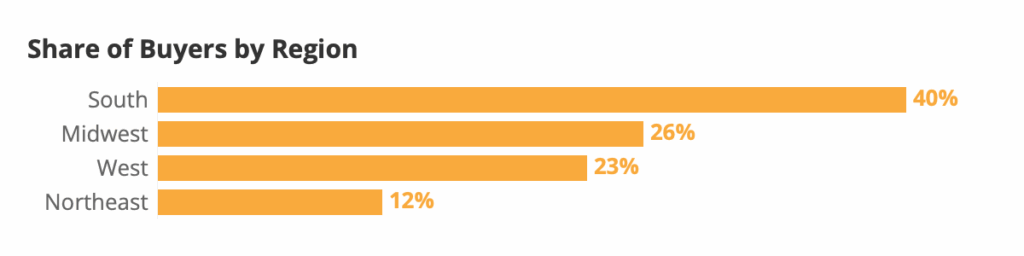
The largest share of buyers live in the South (43%), followed by the Midwest (23%) and West (21%). The smallest share lives in the Northeast (13%). Buyers largely follow the distribution of US adults, with a higher concentration in the South – the region with the most home construction and inventory.
The table below also compares this distribution of buyers by region with the distribution of for-sale inventory that we see on our site. Consistent with the graph above, the South has the most for-sale inventory, while the Northeast has the least.
| Region | Buyers | Household Decision Makers | US Adults | For Sale Housing Inventory | Inventory (Field Period) |
| South | 40% | 39% | 39% | 55% | 54% |
| West | 23% | 22% | 24% | 20% | 19% |
| Midwest | 26% | 21% | 20% | 15% | 15% |
| Northeast | 12% | 17% | 17% | 10% | 12% |
Source: Household decision maker and US adult estimates from Census Bureau, 2023 Current Population Survey Annual Social and Economic Supplement Share of For Sale Housing Inventory comes from Zillow’s listings data as of July 11th, 2024.
Approximately 10% of buyers identified as LGBTQ+ in 2025
The percentage of buyers identifying as LGBTQ+ has been relatively stable over the last few years. About one in fourteen (7%) buyers identified as LGBTQ+ in 2019, the first year CHTR asked about sexual orientation and gender identity, then 9% in 2020 and in 2023.2 This likely represents the growing share of younger buyers, who may be more likely to feel comfortable self-identifying as LGBTQ+.
Buyers that identified as LGBTQ+
| 2019 | 2020 | 2021 | 2022 | 2023 | 2024 | 2025 |
| 7% | 9% | 12% | 10% | 9% | 11% | 10% |
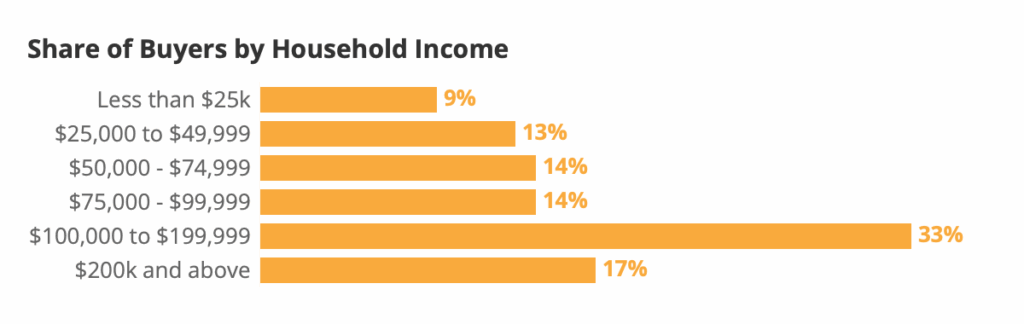
Unsurprisingly, buyers tend to have higher household incomes than the U.S. population overall. The annual median household income among buyers is approximately $97,600, compared to the overall national median of $74,600.3
| Income | Buyer Households | All US Households |
| Less than $25k | 9% | 14% |
| $25,000 to $49,999 | 13% | 17% |
| $50,000 – $74,999 | 14% | 16% |
| $75,000 – $99,999 | 14% | 12% |
| $100,000 to $199,999 | 33% | 26% |
| $200k and above | 17% | 14% |
Source: All US household estimates from Census Bureau, 2024 Current Population Survey Annual Social and Economic Supplement
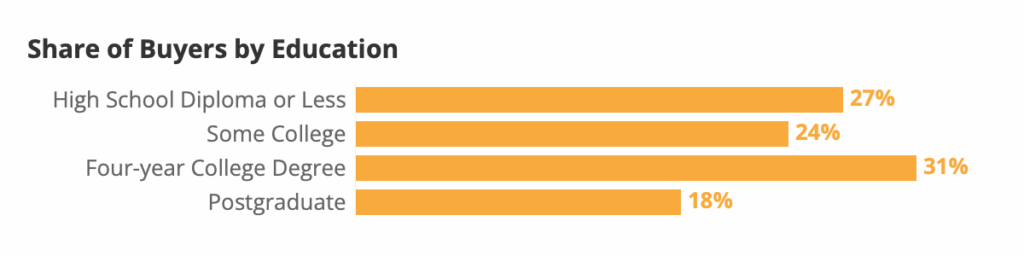
Buyers tend to be more educated than the overall population of U.S. adults: 49% of buyers have at least a four-year degree, higher than 35% of overall U.S. adults.
| Education | Buyers | Household Decision Makers | US Adults |
| High School Diploma or Less | 27% | 34% | 38% |
| Some College | 24% | 27% | 26% |
| Four-year College Degree | 31% | 24% | 22% |
| Postgraduate | 18% | 15% | 13% |
Source: All household estimates from Census Bureau, 2024 Current Population Survey Annual Social and Economic Supplement
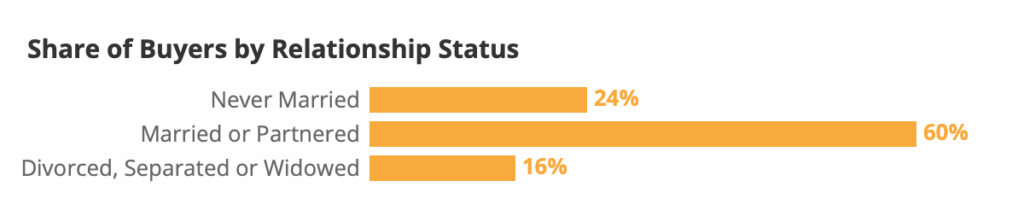
Prior research has shown that the purchase of a home is often tied to family formation or other life events, like a divorce or separation. This relationship between homeownership and family formation helps explain why over two thirds of buyers are married/partnered (70%) and almost a sixth (15%) have been married in the past.
| Relationship Status | Buyers | Household Decision Makers | US Adults |
| Never Married | 24% | 18% | 28% |
| Married or Partnered | 60% | 59% | 55% |
| Divorced, Separated or Widowed | 16% | 23% | 17% |
Source: All household estimates from Census Bureau, 2023 Current Population Survey Annual Social and Economic Supplement
Buyer households are more likely to report having at least one pet (76%) than a child (43%). Dogs are the most common pet among buyer households (64% report having at least one) followed by cats (42%).
| In Household | Buyer Households | Tenured Homeowner Households | All Households5 | |
| Children under 186 | 36% | 44% | 43% | |
| Plant | 62% | – | – | |
| Dog | 64% | 46% | 38% | |
| Cat | 42% | 34% | 22% | |
| Another pet | 12% | 10% | 10% | |
| NET: Any pet | 76% | 61% | 50% | |
When asked about the order they completed homebuying tasks, the most common first step was contacting a real estate agent (52%). 80% of buyers reported contacting an agent as their 1st, 2nd or 3rd homebuying activity.
| 1st | 2nd | 3rd | First 3 | |
| Contact a real estate agent, realtor or broker | 52% | 12% | 16% | 80% |
| Contact a mortgage lender | 18% | 19% | 16% | 53% |
| Get pre-approved for a mortgage | 14% | 26% | 16% | 55% |
| Attend an open house | 8% | 10% | 10% | 27% |
| Buy homeowner’s insurance | 5% | 6% | 4% | 15% |
| Take a private, in-person tour of a home | 4% | 28% | 23% | 55% |
| Made an offer on a home | 0% | 0% | 12% | 13% |
A smaller share (18%) said that contacting a mortgage lender was their first step – 53% said contacting a lender was among their first 3 steps. Similarly, 55% of buyers said they got pre-approved for a mortgage within their first 3 steps – but only 14% said it was their first activity.
Of the most common buyer activity sequences, buyers were more likely to start with contacting an agent (39%) than contacting a lender (13%) or getting pre-approved (5%).
Buyers’ most common second step was taking a private, in-person home tour (28%). About half (51%) report such a private tour as their 2nd or 3rd step. A near-unanimous 94% of buyers said that a real estate agent or someone from their brokerage firm helped them access and tour for-sale properties at least once.
Agents were also the most common way that buyers reported finding an open house (58%) – higher than real estate websites (35%) like Zillow.
Most buyers (79%) reported installing a real estate app during the homebuying process. Among this app-installing group, 86% reported installing before the other steps we asked about (e.g. contacting an agent, lender, touring, pre-approval, etc).
As of completing the survey, most buyers that installed such an app said they never uninstalled it (55%) while a third (36%) said they uninstalled after buying their home. Only 9% of app-installers reported uninstalling before they finished their home purchase.
About 60% of buyers said that their experience buying a home was at least somewhat stressful. About a quarter (25%) said it was very or extremely stressful.
| Homebuying stress | Total | First- time | Repeat |
| Very/extremely stressful | 25% | 31% | 19% |
| At least somewhat stressful | 60% | 66% | 56% |
| Not very/at all stressful | 40% | 34% | 44% |
| Homebuying stress | Total | Gen Z (Ages 18-30) | Millennial (Ages 31-45) | Gen X (Ages 46-60) | Boomers + Silent Gen (61+) |
| Very/extremely stressful | 25% | 30% | 27% | 25% | 16% |
| At least somewhat stressful | 60% | 74% | 64% | 57% | 48% |
| Not very/at all stressful | 40% | 26% | 36% | 43% | 52% |
| Homebuying stress | Total | 18-29 | 30-39 | 40-49 | 50-59 | 60+ |
| Very/extremely stressful | 25% | 30% | 28% | 29% | 22% | 16% |
| At least somewhat stressful | 60% | 74% | 65% | 62% | 55% | 48% |
| Not very/at all stressful | 40% | 26% | 35% | 38% | 45% | 52% |
| Homebuying stress | Total | White | Black | Hispanic | AAPI | Nonwhite |
| Very/extremely stressful | 25% | 24% | 19% | 31% | 26% | 25% |
| At least somewhat stressful | 60% | 59% | 55% | 66% | 74% | 64% |
| Not very/at all stressful | 40% | 41% | 45% | 34% | 26% | 36% |
A slight majority of buyers (56%) reported purchasing supplemental disaster insurance coverage for at least one type of disaster in addition to their homeowner’s insurance policy, while 44% did not.
Most Common Coverage: Flood insurance is the most commonly purchased supplemental coverage overall (36% of buyers), followed by Tornado (23%), and Hurricane (22%).
| Supplemental disaster insurance coverage | Total | First- time | Repeat |
| Earthquake | 19% | 23% | 16% |
| Flood | 36% | 43% | 31% |
| Hurricane | 22% | 25% | 20% |
| Landslide | 9% | 12% | 8% |
| Tornado | 23% | 28% | 18% |
| Another disaster not listed above | 5% | 8% | 4% |
| None of the above | 44% | 33% | 52% |
| Supplemental disaster insurance coverage | Total | Midwest | Northeast | South | West |
| Earthquake | 19% | 14% | 19% | 12% | 36% |
| Flood | 36% | 27% | 39% | 43% | 34% |
| Hurricane | 22% | 6% | 17% | 37% | 16% |
| Landslide | 9% | 6% | 12% | 9% | 13% |
| Tornado | 23% | 25% | 17% | 28% | 14% |
| Another disaster not listed above | 5% | 4% | 3% | 5% | 9% |
| None of the above | 44% | 56% | 49% | 34% | 46% |
| Supplemental disaster insurance coverage | Total | California | Florida | New York | Texas | Other |
| Earthquake | 19% | 55% | 9% | 36% | 11% | 15% |
| Flood | 36% | 34% | 39% | 47% | 47% | 34% |
| Hurricane | 21% | 16% | 52% | 27% | 29% | 18% |
| Landslide | 9% | 18% | 6% | 24% | 8% | 8% |
| Tornado | 23% | 17% | 15% | 34% | 27% | 24% |
| Another disaster not listed above | 6% | 7% | 4% | 6% | 4% | 6% |
| None of the above | 44% | 31% | 30% | 36% | 31% | 49% |
Buyers who used cash were slightly more likely to have no supplemental coverage (50%) compared to mortgage buyers (42%).
| Supplemental disaster insurance coverage | Total | Cash | Mortgage |
| Earthquake | 19% | 20% | 19% |
| Flood | 36% | 31% | 38% |
| Hurricane | 22% | 21% | 22% |
| Landslide | 9% | 10% | 9% |
| Tornado | 23% | 19% | 24% |
| Another disaster not listed above | 5% | 5% | 6% |
| None of the above | 44% | 50% | 42% |
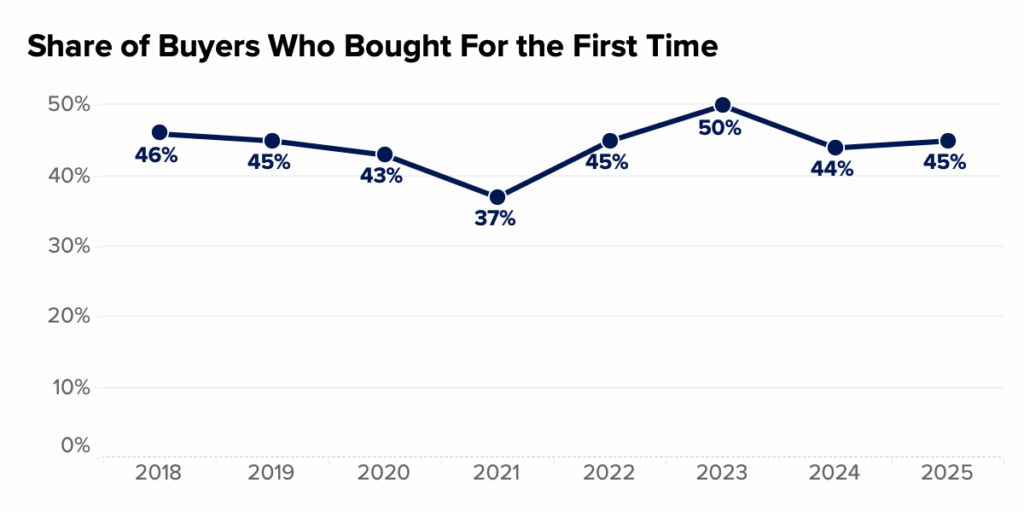
In 2025, the share of buyers who reported purchasing for the first time rose to 45%.
| Share of Buyers that Bought For the First Time | |||||||
| 2018 | 2019 | 2020 | 2021 | 2022 | 2023 | 2024 | 2025 |
| 46% | 45% | 43% | 37% | 45% | 50% | 44% | 45% |
| Home search duration | |
| Less than 1 month | 11% |
| 1 to less than 2 months | 18% |
| 2 to less than 3 months | 19% |
| 3 to less than 4 months | 15% |
| 4 to less than 6 months | 15% |
| 6 months or more | 22% |
| Median | 3-4 months |
Most buyers (61%) purchase and share ownership of their home with at least one other person. Half of buyers (52%) cobought with a partner or spouse. Cobuying with a relative (8%) and/or friend (5%) was less common.
| Cobought with | Feb- April 2022 | Dec 2022 | 2023 | 2024 | 2025 |
| Spouse/partner | 45% | 60% | 50% | 52% | 52% |
| Friend | 10% | 4% | 14% | 7% | 5% |
| Relative | 11% | 6% | 12% | 9% | 8% |
| NET: Friend/relative | 18% | 8% | 21% | 15% | 12% |
| Any cobuy | 58% | 65% | 62% | 63% | 61% |
| Did not cobuy | 42% | 35% | 38% | 37% | 39% |
Most married or partnered buyers cobuy (75%) – most with a spouse or partner (68%).7 Buyers who are single and never married are most likely to cobuy with a friend or relative (18%, versus 10% of divorced/separated/widowed and 11% of married/partnered buyers).
The typical (median) buyer this year reported submitting one offer.
| 2018 | 2019 | 2020 | 2021 | 2022 | 2023 | 2024 | 2025 | |
| 0 Offers | 10% | 11% | 9% | 6% | 5% | 8% | 9% | 10% |
| 1 Offer | 52% | 49% | 48% | 36% | 39% | 38% | 46% | 47% |
| 2 Offers | 23% | 23% | 23% | 28% | 27% | 27% | 27% | 26% |
| 3 Offers | 8% | 10% | 10% | 18% | 16% | 16% | 12% | 12% |
| 4 Offers | 3% | 3% | 3% | 7% | 6% | 5% | 4% | 3% |
| 5 or More Offers | 4% | 4% | 7% | 6% | 6% | 5% | 2% | 2% |
| Median number of offers | 1 | 1 | 1 | 1 | 2 | 2 | 1 | 1 |
About two thirds of buyers (65%) say their final offer was contingent on the property passing a home inspection. Over half (59%) said the same about successfully receiving financing (e.g. mortgage approval). Contingency on the property appraising at a minimum amount was similarly common (53%). A mortgage rate buydown – where the seller agrees to buy down the buyer’s interest rate – was the least common: About a quarter of buyers (22%) said they won such a concession in their final offer.
| Share of buyers that report including each contingency in their final offer | 2022 | 2023 | 2024 | 2025 |
| Financing | 61% | 61% | 56% | 59% |
| Appraisal | 59% | 58% | 52% | 53% |
| Inspection | 70% | 67% | 66% | 65% |
| Sale of my previous home recoded | 29% | 26% | 23% | 21% |
| Mortgage buydown |
|
32% | 24% | 22% |
| Insurance (new in 2025) | 53% | |||
| At least 1 contingency | 85% | 82% | 82% | 85% |
Consistent with past years, buyers surveyed in 2025 did not budge when it came to forgoing inspections: Relatively few (14%) said that they did not get any inspections prior to purchasing their home.
| 2018 | 2019 | 2020 | 2021 | 2022 | 2023 | 2024 | 2025 | |
| 0 inspections – I did not have any inspections conducted | 15% | 17% | 18% | 14% | 13% | 8% | 17% | 14% |
| 1 inspection | 60% | 58% | 53% | 45% | 53% | 38% | 54% | 59% |
| 2 inspections | 16% | 16% | 16% | 19% | 17% | 27% | 18% | 17% |
| 3 inspections | 5% | 4% | 6% | 13% | 10% | 16% | 9% | 6% |
| 4 inspections | 1% | 2% | 2% | 6% | 4% | 5% | 2% | 2% |
| 5 inspections or more | 2% | 4% | 6% | 4% | 3% | 5% | 1% | 1% |
| Median inspections | 1 | 1 | 1 | 1 | 1 | 2 | 1 | 1 |
Obtaining a pre-inspection report from the seller/builder is also quite common: Among buyers that remember, 64% said they got one, versus 36% who say they did not.
| Among buyers that remember whether they got a pre-inspection report | 2024 | 2025 |
| Got pre-inspection report | 66% | 64% |
| No pre-inspection report | 34% | 36% |
Among buyers that reported having no inspection of their own conducted, 37% reported getting a pre-inspection report. These no-inspection buyers were less likely to purchase a single-family detached house (59% versus 80%) and were more likely to buy a manufactured/mobile home (20% versus 5%) or a boat/RV/van/etc (5% versus 1%).
Most buyers reported using an agent among the resources they used to shop, search, or purchase their home (84%). Among buyers that used an agent, 75% say they hired their agent to help shop for and purchase their home. About a quarter (25%) hired an agent to finalize their home purchase, but shopped on their own.
| Resource used during any part of searching, shopping for or purchasing their home | 2019 | 2020 | 2021 | 2022 | 2023 | 2024 | 2025 |
| Real estate agent, broker or realtor | 82% | 85% | 82% | 89% | 88% | 85% | 84% |
First-time buyers (83%) and repeat buyers (86%) report using an agent at similar rates.
About a third (32%) of buyers that paid less than $100,000 for their home said they did not use an agent – higher than 16% of buyers overall.
Among buyers that did not use an agent, about a fifth purchased a manufactured or mobile home (19%) – versus only 2% among buyers who used an agent.
Among buyers that did not use an agent, almost half (48%) said they already knew the seller (45%) or purchased their home from someone they knew personally (41%) (like a friend, family member, or coworker).
Not wanting to pay a real estate agent’s commission (35%) was another common reason.
| First found agent | 2018 | 2022 | 2023 | 2024 | 2025 |
| Real estate website / app (e.g. Zillow, RE/MAX, Realtor.com) | 16% | 18% | 25% | 23% | 22% |
| Referral from friend, relative, neighbor or colleague | 27% | 21% | 18% | 22% | 20% |
| Know them from my community | 7% | 12% | 6% | 8% | 11% |
| Past experience with this agent or broker | 10% | 8% | 8% | 8% | 9% |
| Social networking website / app (e.g. Facebook, NextDoor, Twitter, Instagram) | 2% | 5% | 8% | 7% | 5% |
| Search engine (e.g. Google, Bing) | 5% | 5% | 7% | 7% | 6% |
| Saw contact information on For Sale/open house sign | 7% | 4% | 5% | 6% | 5% |
| Attended an open house and met agent or broker | 5% | 5% | 4% | 5% | 6% |
| Referral from another agent or broker | 6% | 7% | 6% | 5% | 7% |
| Referral from home builder | 2% | 3% | 5% | 4% | 3% |
| Direct mail (e.g. newsletter, flier, postcard) | 2% | 3% | 3% | 2% | 2% |
| Newspaper ad | 2% | 1% | 1% | 1% | 2% |
| Other | 9% | 8% | 6% | 3% | 2% |
| Net: Online | 23% | 28% | 40% | 37% | 33% |
| Net: Referral | 35% | 31% | 28% | 30% | 30% |
To gain a comprehensive understanding of the US homebuyers, Zillow Group Population Science conducted six nationally representative surveys – collecting over 57,600 responses (approximately 20,000 from successful buyers and 37,600 from prospective buyers). The survey contains information from approximately 10,200 unique successful buyers and 18,100 unique prospective buyers. The study was fielded between April and September 2025.
Wherever possible, survey questions from previous years were asked in the same manner this year to allow for the measurement of year-to-year trends in key areas of business interest.
For the purpose of this study, “successful buyers” – typically shortened to “buyers” refers to household decision makers 18 years of age or older who moved to a new primary residence that they purchased in the past two years. A majority of buyers in this sample (54% unweighted; 55% weighted) purchased within the past year.
Results from this survey are nationally representative of successful buyers. US adult decision makers were identified from online nonprobability samples. To achieve representativeness, we used a combination of quota sampling and statistical raking using benchmarks estimated from the 2023 American Community Survey (ACS) and the 2024 Current Population Survey Annual and Economic Supplement (CPS ASEC).
To ensure that this weighting procedure did not drive observed results, we created several alternative sets of weights for key estimates of interest. These alternative weights included several versions with additional population characteristics– especially those that could be correlated with estimates of interest– from external sources, as well as propensity matching to better capture a given respondent’s underlying probability of participating in the survey. None of the alternative sets of weights substantively shifted the estimates examined.
To reduce response bias, survey respondents did not know that Zillow Group was conducting the survey. Several additional quality control measures were also taken to ensure data accuracy:
[1] Zillow Group Population Science defines Gen Z as those born between 1995 and 2003, Millennials between 1980 and 1994, Gen X between 1965 and 1979, Baby Boomers between 1945 and 1964, and Silent Generation in 1944 and earlier.
[2] LGBTQ+ buyers are those who identified as gay, lesbian, bisexual, transgender, gender non-conforming/non-binary, intersex, or with another sexual orientation (other than straight) or gender identity (e.g. gender fluid, gender queer, gender neutral).
[3] Median household incomes are from Census Bureau, 2023 Current Population Survey Annual Social and Economic Supplement.
[4] These estimates come from CHTR 2023 and the 2019 American Community Survey.
[5] The estimated share of all households with pets comes from American Housing Survey (AHS) 2021. These numbers are likely systematically low because of rising pet ownership following the COVID-19 pandemic. AHS also excludes service animals and livestock from their survey definition, whereas CHTR does not specify exclusions for any animals/pets.
Tenured homeowner household pet estimates come from CHTR 2021 (the last year CHTR included tenured homeowners) while buyer estimates are from CHTR 2023.
[6] The estimated shares of households (buyer, tenured homeowner, and all households) with children comes from the 2023 Current Population Survey Annual Social and Economic Supplement.
[7] This survey defines “cobuying” as sharing ownership of the home with at least one other person. While more than 71% of married/partnered buyers likely reside with or involve their spouse or partner in their home purchase, 71% is the share who self-report sharing ownership of the home with their spouse/partner.
