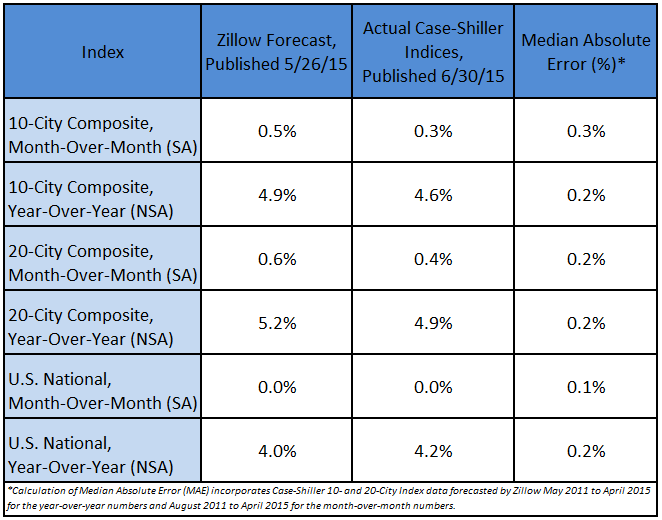
Today, the S&P/Case-Shiller Home Price Indices showed that the non-seasonally adjusted (NSA) April 10- and 20-City Composites rose 4.6 percent and 4.9 percent, respectively, on a year-over-year basis. The U.S. National Index rose 4.2 percent year-over-year. Today’s data were in line with Zillow’s forecasts, released last month.
On a seasonally adjusted (SA) monthly basis, the 10- and 20-City Composites were up 0.4 percent and 0.3 percent, respectively, from March to April. The National Index was flat month-over-month (SA). The table below shows how Zillow’s forecast compared with the actual numbers.
“New and existing home sales are both up, and home price growth continues to slow down. The fact that these indicators are moving in opposite directions actually means the market overall is moving in the right direction – back to normal,” said Zillow Chief Economist Dr. Stan Humphries. “Normal sales volumes are typically higher than we have been seeing, so recent gains are very encouraging and a sign that demand is strong among more typical buyers as we head into summer. Normal home value growth is usually between 3 percent and 5 percent annually, well below growth rates of just a year ago, so the current pace is far more sustainable. Local market dynamics – rather than larger, national economic trends – are dictating market conditions on the ground in individual communities, as they should. All of these trends signal good news for the market.”
Our forecasting model incorporates previous data points of the Case-Shiller series, as well as Zillow Home Value Index data and national foreclosure resales. To see how Zillow’s forecast of the March Case-Shiller indices compared, see our research brief from last month.
Our forecast for May calls for similar appreciation across the three main Case-Shiller indices.
