 In March 2013 CoreLogic purchased the S&P/Case-Shiller indices. They spent the past year revising the S&P/Case-Shiller U.S. National Home Price Index to use CoreLogic’s data. To better understand the revised index, we compared it to the previous S&P/Case-Shiller U.S. National Home Price Index and the Zillow Home Value Index (ZHVI).
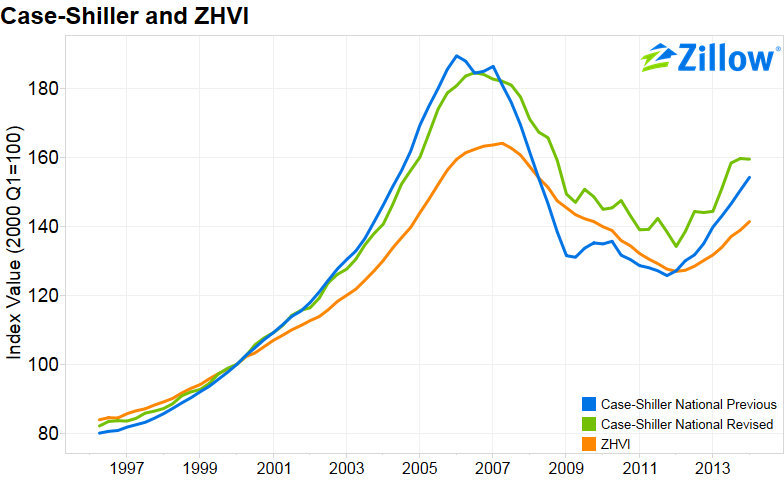
To the right is a graph of the previous Case-Shiller index, the revised Case-Shiller index and ZHVI. The revised Case-Shiller index is closer to ZHVI than the previous index. Compared to the previous index the height of the bubble is not as high and the decline is less dramatic, similar to ZHVI.
When comparing these two indices, both of which are used as measures of health of the housing market, it is important to remember they measure two different things. The Case-Shiller National Index uses a repeat sales methodology, which uses homes that have sold[1] at least twice to measure price change. The problem is different segments of homes may appreciate at different rates and different segments of homes may not be proportionally represented when only considering homes that have sold at least twice. While this may give a good view of changing house prices that are being sold, it could provide a biased view when applied to the entire U.S. housing stock.
To learn more about the Zillow Home Value Index and its differences from a repeat sales index, see this previous post featuring a video of Stan Humphries, Zillow Chief Economist, discussing the differences and advantages of ZHVI with CoreLogic Chief Economist Mark Flemming. For more on ZHVI vs. Case-Shiller, click here.
[1]Home sales included in the index are intended to be arms-length, repeat sales for single family homes. This would exclude new construction.
