New Construction Buyers: Results from the Zillow Consumer Housing Trends Report 2023
A global pandemic, historic economic change and an unprecedented shift in the housing market have been hallmarks of the past few years. But while these large-scale changes have shifted the landscape and have the potential to reshape buyers’ preferences over the longer term, many behaviors and attitudes remain the same.
The 2023 Consumer Housing Trends Report (CHTR) provides a snapshot of what housing consumers are thinking and doing in mid-2023. In this report, we take a deeper look at new construction buyers — household decision makers that own their primary residence and moved to a new construction home they purchased in the past two years. Information about who new construction buyers are in 2023 can equip consumers with the tools they need to make informed decisions in the current housing market landscape.
In order to gain a comprehensive understanding of U.S. new construction buyers, Zillow Group Population Science conducted a nationally representative survey of more than 2,500 new construction buyers – buyers that purchased a new construction home in the past 2 years. To compare with existing home buyers, the survey also sampled over 4,000 existing home buyers that purchased in the past 2 years. The study was fielded between April and July 2023. Wherever possible, survey questions from previous years were asked in the same manner this year to allow for the measurement of year-to-year trends in key areas of interest.
For the purpose of this study, “new construction buyers” refers to household decision makers 18 years of age or older who moved to a newly built primary residence that they purchased in the past two years. To qualify, the residence had to be built in the past two years and they had to be the first household to live there.
Results from this survey are nationally representative of new construction buyers. To achieve representativeness, ZG Population Science used a two-prong approach. First, the initial recruitment to the sample was balanced to all new construction buyers from the U.S. Census Bureau, 2021 American Community Survey (ACS) on the basis of age, relationship status, income, ethnicity/race, education, region and sex. Additional targeted subgroups were sampled based on all key household demographic characteristics. Second, statistical raking was used to create calibration weights to ensure that the distribution of survey respondents matched the U.S. population with respect to a number of key demographic characteristics. [1]
To reduce response bias, survey respondents did not know that Zillow Group was conducting the survey. Several additional quality control measures were also taken to ensure data accuracy:
Unless otherwise specified, estimates in this report come from the Consumer Housing Trends Report (CHTR) 2023, and year-over-year comparisons also use data from CHTR 2018, CHTR 2019, CHTR 2020, CHTR 2021 and CHTR 2022. To provide a fuller picture of the state of home rentals and buyers’ characteristics, preferences and behaviors, we also analyzed data from other sources:
In this section, we provide a high-level overview of key information on both new construction and existing home buyers, as well as the characteristics of the homes they buy. According to the Census Bureau American Community Survey (ACS), 5% of adults in the country are recent buyers. Just under 1% (0.7%) of households are new construction buyers. Throughout this section, information about new buyers comes from CHTR, and information about other groups comes from ZG Population Science analyzes using ACS data. [2]
Both new construction and existing home buyers are generally similar in age. The median ages of both types of buyers are remarkably similar – differing by no more than one year.
| Age Group | New Construction Buyers | Existing Home Buyers |
| Ages 18-29 | 14% | 19% |
| Ages 30-39 | 30% | 26% |
| Ages 40-49 | 22% | 18% |
| Ages 50-59 | 13% | 16% |
| Ages 60-69 | 13% | 13% |
| Ages 70+ | 9% | 8% |
Sources: US Census Bureau, 2021 American Community Survey.
Consistent with age, the largest generational group of new construction buyers is between 29 and 43 years old in 2023 — the group colloquially known as “Millennials.” About 41% of new construction buyers are Millennials.
| Generation [3] | New Construction Buyers | Existing Home Buyers |
| Gen Z (18-28) | 13% | 17% |
| Millennial (29-43) | 40% | 37% |
| Gen X (44-58) | 25% | 24% |
| Baby Boomer (59-78) | 20% | 20% |
| Silent Generation (79+) | 3% | 2% |
Sources: Census Bureau, 2021 American Community Survey.
The largest share of new construction buyers live in the South (56%), followed by the West (23%) and Midwest (14%). The smallest share lives in the Northeast (7%).
| Region | New Construction Buyers | Existing Home Buyers | Total Buyers |
| South | 57% | 39% | 41% |
| West | 22% | 22% | 22% |
| Midwest | 14% | 23% | 23% |
| Northeast | 6% | 16% | 14% |
Sources: Census Bureau, 2021 American Community Survey. 2022 Current Population Survey Annual Economic and Social Supplement
About one in every five new construction buyers buys their home in Texas (19%). About one in eight buys in Florida (13%). Of the top ten states for new construction buyers, six are in the South. The other four come from Western states.
Idaho comes close to Texas when measuring the percent of buyers that purchased new construction – 15% in both states. Utah (14%) and South Carolina (14%) follow closely.
| Top 10 States for New Construction | Percent of Buyers that Buy New Construction | Percent of New Construction Buyers | Count of New Construction Buyer Households |
| Texas | 15% | 19% | 69,422 |
| Florida | 10% | 13% | 48,363 |
| California | 5% | 6% | 22,053 |
| Georgia | 9% | 5% | 17,410 |
| South Carolina | 14% | 5% | 17,200 |
| North Carolina | 8% | 4% | 14,334 |
| Tennessee | 11% | 4% | 14,132 |
| Colorado | 8% | 3% | 11,243 |
| Washington | 6% | 3% | 9,379 |
| Arizona | 6% | 2% | 8,785 |
Source: Census Bureau, 2022 American Community Survey
Count of New Construction Buyers, by State

Source: Census Bureau, 2022 American Community Survey
Percent of Buyers that Bought New Construction, by State
 Source: Census Bureau, 2022 American Community Survey
The typical new construction buyer’s income was about 22% higher than existing home buyer’s in 2021. Based on the median overall buyer household income (approximately $96,590), the typical new construction buyer household makes an estimated $118,054, versus $96,375 for existing home buyer households – both significantly higher than the overall national median (2022) of $70,784. [4]
| Education | New Construction Buyers | Existing Home Buyers |
| High School Diploma or Less | 19% | 23% |
| Some College | 27% | 27% |
| Four-year College Degree | 32% | 29% |
| Postgraduate | 22% | 20% |
Sources: Census Bureau, 2021 American Community Survey.
Cobuying – purchasing and sharing ownership of their home with at least one other person – is the norm for most buyers (62%) and even more so for those who buy new construction (66%). This difference is largely due to new construction buyers being more likely to cobuy with a spouse or partner. New construction and existing home buyers were similarly likely to cobuy with a friend or relative.
| Cobought with | Total Buyers | New Construction Buyers | Existing home Buyers |
| Spouse/partner | 50% | 55% | 47% |
| Any cobuy | 62% | 66% | 58% |
| Did not cobuy | 38% | 34% | 42% |
Most new construction buyers (74%) say that at least one pet lives in their home with them. About two thirds (66%) have a dog. Almost half (44%) have a cat, and 12% have another kind of pet.
New construction buyers were more likely to report that their pet(s) influenced their homebuying decisions a lot (35% versus 30% for existing home buyers). Overall, 62% of new construction buyers reported that pets influenced their homebuying decisions at least somewhat – 80% among new construction buyers with pets in their home.
New construction buyers were also more likely to consider at least one pet feature as “essential” in their home (73% versus 67% of existing home buyers). A fenced backyard (59%) was the most common essential, followed by a doghouse (34%) and being within walking distance of a dog park (26%).
New construction buyers are more likely to say that they recently bought (within the past two years) or intend to buy (within the next 12 months) a host of big-ticket items. These include a TV (68% versus 56%), laptop (56% versus 47%), car (63% versus 51%), flight ticket (55% versus 44%), household appliances (73% versus 63%), and a mobile phone (71% versus 62%).
| Bought or intend to buy | General US Population | Total Buyers | New Construction Buyers | Existing Home Buyers |
| TV | 49% | 62% | 68% | 56% |
| Laptop | 42% | 53% | 59% | 47% |
| Car | 36% | 57% | 63% | 51% |
| Flight ticket | 39% | 48% | 55% | 44% |
| Household appliances | 48% | 67% | 73% | 63% |
| Mobile phone | 62% | 65% | 71% | 62% |
New construction buyers surveyed in 2023 were more likely than those in past years to say that, when they started their home search, they were only interested in new construction. About two in five (42%) said they were only interested in new construction homes (versus 36% last year and 32% in 2021). A smaller share (13%) said they were more interested in existing homes (versus 21% last year), and 10% said they were only interested in existing homes – but ended up buying new construction anyway.
| New construction buyers | 2020 | 2021 | 2022 | 2023 |
| Only interested in new construction | 40% | 32% | 36% | 42% |
| More interested in new construction, willing to consider existing homes | 35% | 38% | 35% | 36% |
| More interested in existing, willing to consider new construction | 14% | 21% | 21% | 13% |
| Only interested in existing homes | 11% | 9% | 7% | 10% |
| NET: Prefer new construction | 75% | 70% | 83% | 78% |
| NET: Prefer existing | 25% | 30% | 17% | 22% |
| NET: Consider new construction | 89% | 91% | 93% | 90% |
Overall, new construction buyers reported being more exclusively interested in their preferred type of construction in 2023 compared to previous years.
A majority of prospective buyers (those that say they intend to buy a home in the next year) indicate that they prefer new construction: 55% said that they were more or only interested in new construction, versus 45% who indicated the same preference for existing homes. Prospective buyers were also more likely to indicate that they prefer new construction (55%) than buyers who ultimately succeed (39%).
Approximately 23% of US adults say they intend to buy a home in the next year, but no more than 5% have succeeded in any given recent year. Put another way, about 34 million prospective buyer households are competing for no more than 6 million homes – about 4 million of which are existing construction. Given such a wide divide between housing supply and demand, builders can count on an ample customer base – especially because these aspiring homeowners report a disproportionate preference for newly built homes.
| Successful Buyers | Successful New Construction Buyers | Prospective Buyers | |
| Only interested in new construction | 17% | 42% | 15% |
| More interested in new construction, willing to consider existing homes | 23% | 36% | 31% |
| More interested in existing, willing to consider new construction | 30% | 13% | 37% |
| Only interested in existing homes | 30% | 10% | 17% |
| NET: Prefer new construction | 39% | 78% | 55% |
| NET: Prefer existing | 61% | 22% | 45% |
| NET: Consider new construction | 70% | 90% | 83% |
About half of new construction buyers said that they initially wanted to buy a completed home (48%) in 2023. About a third initially intended to purchase a home they could work with a builder to construct from scratch (33%). The share that intended to purchase an under-construction, customizable home appears to have fallen slightly since 2021 (19% in 2023, 21% in 2022 and 23% in 2021).
While they ended up purchasing an existing home in the end, a small share of existing home buyers said they wanted a home they could build from scratch (9%) or an under-construction home they could customize (9%) — indicating that almost one in five existing home buyers wanted the types of customizations that new construction builders could provide.
 Prospective buyers express greater intent on customization
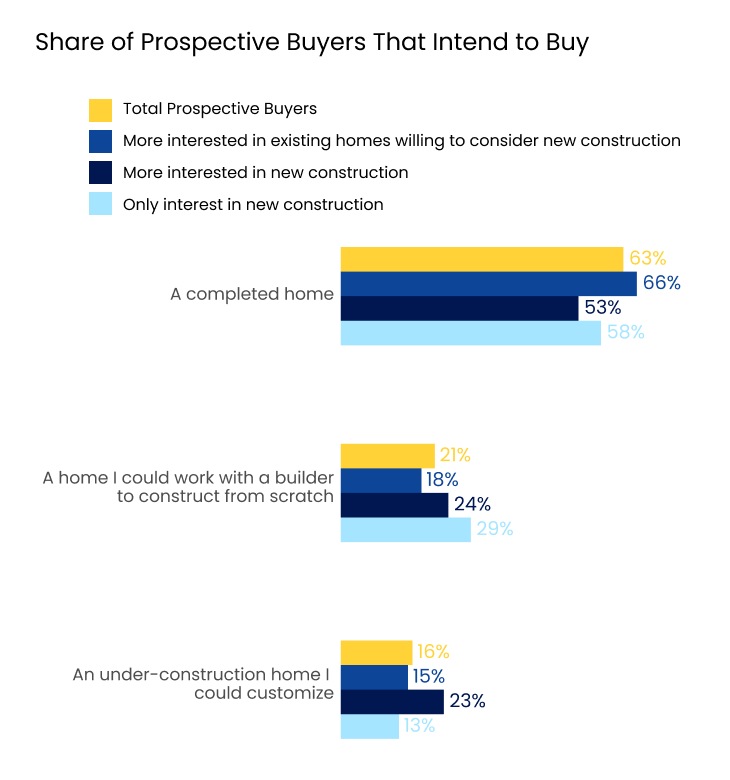
Majorities of both successful (70%) and prospective (63%) buyers say that they initially wanted or intend to buy a completed home, but prospective buyers were more likely to report intent to buy a customizable under-construction home (16% or prospective versus 13% of successful buyers) or to build from scratch (21% versus 17%).

The higher likelihood of prospective buyers to report a “relaxed” timeline to buy a home may help explain their greater intent to buy a customizable home: less urgency means that they can handle delays and uncertainty about home completion. Half (50%) of prospective buyers said their timeline was “relaxed” – that they could take their time and explore their options. Only 41% of successful buyers (and 34% of existing home buyers) said the same. Prospective buyer timelines were most similar to that of successful new construction buyers – half (50% of prospective buyers and 49% of successful new construction buyers) of both reporting a “relaxed” timeline.

The stage of construction that prospective buyers say they intend to purchase generally follows their construction preferences; those who express greater interest in existing homes are the most likely to report intent to buy a completed home (66% of prospective buyers who were more interested in existing homes reported intent to buy a completed home, versus 53% of those more interested in new construction and 58% of those only interested in new construction). Conversely, prospective buyers who only indicated interest in new construction homes were most likely to report intent to build from scratch (29%, versus 24% of those who were interested in new construction but willing to consider existing, and 18% of those more interested in existing homes).
New construction buyers are most likely to say that they purchased in a subdivision or community of other new construction homes (60%). This finding represents a continuing decrease in the share that reported buying in such a community. Conversely, about two in five (40%) new construction buyers said they purchased a home in an existing community – suggesting that builders are increasingly offering infill options for buyers.

| New construction buyers | 2020 | 2021 | 2022 | 2023 |
| Bought in a new subdivision or community of other new construction homes | 77% | 70% | 67% | 60% |
| Bought in an existing community | 23% | 30% | 33% | 40% |
Despite increasing each year, current trends suggest that new construction in existing communities still has room to grow to meet prospective buyer demand: While 40% of successful new construction buyers say they purchased in an existing community, 47% of prospective buyers say they would buy in such a community when purchasing new construction.
| If they had to choose when purchasing a new construction home, prospective buyers would buy in a(n) | Total Prospective Buyers | More interested in existing, willing to consider NC | More interested in NC | Only interested in NC |
| New subdivision or community of other new construction homes | 53% | 37% | 62% | 80% |
| Existing community | 47% | 63% | 38% | 20% |
Since 2021, existing home buyers have become less likely to cite a lack of new construction homes in their desired location – likely, in part, attributable to the increasing share of new construction options in existing communities. In 2021, existing home buyers were more likely to cite a lack of homes in their desired location (44%) than any other option. That number fell to 37% in 2022, and 35% in 2023.
Conversely, the share of existing home buyers that cite difficulty financing new construction (38% in 2023, 34% in 2022, 31% in 2021) and a preference for older/existing home style (38% in 2023, 34% in 2022, 32% in 2021) have seen slight increases.
| Reasons existing home buyers say they didn’t buy/didn’t initially consider new construction | 2021 | 2022 | 2023 |
| Difficulty financing new construction, or easier to get a loan for existing home | 31% | 34% | 38% |
| Prefer the style of older/existing homes | 32% | 34% | 38% |
| No new construction homes in my desired location | 44% | 37% | 35% |
| Concerns about quality of construction and/or building materials | 29% | 27% | 25% |
| Worried about depreciation/resale value of new construction home | 24% | 15% | 19% |
| Couldn’t imagine what a new home would look like built | 24% | 12% | 13% |
About two in five new construction buyers (43%) say that the home being move-in ready, without any need for repairs or updates, was their number one reason for buying a new construction home. Three in four (74%) cited it among their top three reasons.
In a distant second place, one in five (21%) ranked customization as their number one reason. And while energy efficiency was less likely to be new construction buyers’ top reason (11%), about three in five (62%) ranked it among their top three.
| Share of New Construction buyers that selected each as their top reason(s) for buying new construction | Number 1 Reason | Top 3 Reasons |
| Move-in ready – no need for repairs or updates | 43% | 74% |
| Energy efficiency | 11% | 61% |
| Modern floor plan | 16% | 60% |
| Home customization | 21% | 57% |
| Lower maintenance cost | 9% | 47% |
New construction buyers were more likely to consider every single home characteristic as very or extremely important. They differed most from existing home buyers when it came to high importance of energy efficiency; about six in seven new construction buyers (86%) considered energy efficiency a very or extremely home characteristic – 34 points higher than existing home buyers (52%).
Other large divides emerged around smart home capabilities (new construction buyers were 31 percentage points more likely to consider them highly important), preferred finishes (30 points), shared community amenities (28 points), kitchen style (27 points), and an en-suite or master bathroom (26 points).
| Considered each home characteristic very or extremely important | New Construction Buyers | Existing Home Buyers |
| Was within my initial budget | 89% | 85% |
| Had air conditioning | 89% | 81% |
| Had preferred number of bedrooms | 83% | 78% |
| Had private outdoor space (e.g. patio, deck, yard) | 79% | 70% |
| Offered off-street parking or a garage | 80% | 70% |
| Had good potential to increase in value | 82% | 69% |
| Had my preferred size / square footage | 82% | 68% |
| Had a floor plan / layout that fit my preferences | 84% | 67% |
| Had ample storage | 78% | 65% |
| Had preferred number of bathrooms | 83% | 64% |
| Had preferred utilities (e.g. gas, electric) | 75% | 64% |
| Had a spare or guest bedroom | 79% | 62% |
| Offered me my own assigned parking place | 75% | 60% |
| Had an en-suite or master bathroom | 84% | 58% |
| Had my preferred style of kitchen | 81% | 54% |
| Was energy efficient | 86% | 52% |
| Had my preferred finishes (e.g. flooring, countertops, appliances) | 78% | 48% |
| Opportunity to rent out entire home in the future to produce rental income | 51% | 34% |
| Had “smart home” capabilities (e.g. with lighting, heating, and electronic devices that can be controlled remotely by smartphone or computer) | 63% | 32% |
| Offered shared community amenities (e.g. clubhouse, fitness center, playground) | 58% | 30% |
| Had a hot tub or pool | 49% | 30% |
| Opportunity to rent out a portion of the home for rental income while living in the home | 48% | 29% |
After falling from 89% in 2019 to 80% in 2020, 89% of new construction buyers surveyed in 2023 said that being within their initial budget was a very or extremely important home characteristic. Despite typically having higher incomes, new construction buyers appear not to be immune to the historically high cost of homeownership and increased mortgage unaffordability.
| New construction buyers considered each home characteristic very or extremely important | 2019 | 2020 | 2021 | 2022 [5] | 2023 |
| Was within my initial budget | 89% | 83% | 83% | 80% | 89% |
| Had air conditioning | 90% | 90% | 87% | 84% | 89% |
| Was energy efficient | 76% | 75% | 81% | 77% | 86% |
| Had a floor plan / layout that fit my preferences | 87% | 85% | 85% | – | 84% |
| Had an en-suite or master bathroom | 81% | 82% | 85% | – | 84% |
| Had preferred number of bedrooms | 85% | 85% | 84% | – | 83% |
| Had preferred number of bathrooms | 81% | 85% | 81% | – | 83% |
| Had my preferred size / square footage | 78% | 79% | 80% | – | 82% |
| Had good potential to increase in value | 73% | 75% | 78% | 83% | 82% |
| Had my preferred style of kitchen | 77% | 80% | 79% | – | 81% |
| Offered off-street parking or a garage | 68% | 74% | 79% | – | 80% |
| Had private outdoor space (e.g., patio, deck, yard) | 70% | 76% | 75% | 74% | 79% |
| Had a spare or guest bedroom | 70% | 75% | 78% | – | 79% |
| Had ample storage | 72% | 74% | 80% | 81% | 78% |
| Had my preferred finishes (e.g., flooring, countertops, appliances) | 76% | 76% | 78% | – | 78% |
| Offered me my own assigned parking place | 61% | 67% | 70% | – | 75% |
| Had preferred utilities (e.g., gas, electric) | 68% | 71% | 75% | – | 75% |
| Had smart home capabilities (e.g. with lighting, heating, and electronic devices that can be controlled remotely by smartphone or computer) | 34% | 45% | 58% | 61% | 63% |
| Offered shared community amenities (e.g., clubhouse, fitness center, playground) | 38% | 42% | 51% | 53% | 58% |
| Opportunity to rent out entire home in the future to produce rental income | 23% | 32% | 44% | – | 51% |
| Had a hot tub or pool | 25% | 33% | 44% | 51% | 49% |
| Opportunity to rent out a portion of the home for rental income while living in the home | 22% | 27% | 41% | – | 48% |
In 2023, new construction buyers were more likely than in previous years to consider each neighborhood characteristic as very or extremely important. They were most likely to consider neighborhood walkability highly important (74%) along with a sense of community or belonging (71%).
| New construction buyers considered each neighborhood characteristic very or extremely important | 2019 | 2020 | 2021 | 2023 |
| In a walkable neighborhood | 62% | 65% | 69% | 74% |
| Offered a sense of community or belonging | 52% | 58% | 64% | 71% |
| Close to shopping, services, and/or leisure activities | 55% | 59% | 63% | 69% |
| Close to family and/or friends | 46% | 46% | 59% | 64% |
| My commute to work or school | 53% | 53% | 59% | 62% |
| Close to public transportation | 26% | 31% | 44% | 50% |
New construction and existing home buyers report financing their home purchases with a mortgage at similar rates.
New construction buyers that finance with a mortgage, however, are more likely to put down more than 20%. Among those that financed with a mortgage, new construction buyers were more likely to say that they put down 21% or more (35% of new construction buyers versus 22% of existing home buyers). The median new construction buyer reported putting down exactly 20%, whereas the median existing home buyer reported 10%-19%. Just under half of existing home buyers (47%) put down 20% or more, versus 57% of new construction buyers.
Saving up over time is the most common source that buyers use to fund their down payments (75% of buyers overall reported using such savings). New construction buyers that finance with a mortgage are more likely to draw from every additional source we asked about compared to their existing home buyer counterparts – including from “the bank of mom and dad”. These sources include a loan (44% among new construction buyers versus 23% for existing home buyers) or gift (49% versus 30%) from friends/family, and selling stocks or other investments (46% versus 24%).
Out of the seven sources we asked about, the average new construction mortgage buyer reported using 3.3, versus 2.3 for existing home buyers.
| Sources Mortgage Buyers Used to Finance their Down Payment | Total Buyers | New Construction | Existing Home |
| From the sale of my previous home | 46% | 52% | 42% |
| Gift(s) from family and/or friends | 39% | 49% | 30% |
| Loan(s) from family and/or friends | 33% | 44% | 23% |
| I used my retirement fund | 32% | 36% | 26% |
| Sold stocks or other investments | 35% | 46% | 24% |
| Other | 23% | 27% | 20% |
| NET: Gift/loan from family/friends | 43% | 54% | 35% |
| Used 2 or more sources | 57% | 63% | 50% |
| Average number of sources (out of 7 options) | 2.8 | 3.3 | 2.3 |
While a large share of mortgage buyers reported using savings to finance their down payment (75%), such savings funded only a third (34%) of the average new construction buyer’s down payment. A similar divide exists for gifts/loans from friends/family: About half (54%) of new construction buyers that finance with a mortgage reported using such funds for their down payment. On average, however, such funds only comprised a fifth (21%) of what they ultimately put down.
| Average Share of Down Payment from Each Source | Total Buyers | New Construction | Existing Home |
| Saved it up over time | 40% | 34% | 40% |
| From the sale of my previous home | 21% | 20% | 23% |
| Gift(s) from family and/or friends | 8% | 9% | 8% |
| Loan(s) from family and/or friends | 8% | 12% | 6% |
| I used my retirement fund | 8% | 7% | 9% |
| Sold stocks or other investments | 8% | 11% | 5% |
| Other | 7% | 7% | 9% |
| NET: Gift/loan from family/friends | 16% | 21% | 14% |
Among buyers that contacted at least one lender, about two in five existing home buyers (42%) ultimately used the first and only lender they contacted – versus about a third (31%) of those who bought new construction.
| Lender contacts | Total Buyers | New Construction | Existing Home |
| 1 lender contacted – I used the first lender I contacted | 37% | 31% | 42% |
| 2 lenders contacted | 31% | 32% | 31% |
| 3 lenders contacted | 21% | 23% | 19% |
| 4 lenders contacted | 8% | 11% | 5% |
| 5 or more lenders contacted | 3% | 4% | 3% |
Among mortgage buyers, those that ultimately purchased new construction were slightly less likely to report getting pre-approved (96% of new construction versus 97% of existing home mortgage buyers).
Among pre-approved buyers, existing home buyers were more likely to cite being ready to make an offer at a moment’s notice (52% of pre-approved existing home buyers versus 44% of those who bought new construction). New construction buyers, however, were more likely to cite finding a home and wanting a pre-approval to make an offer (44% of pre-approved new construction buyers versus 34% of those who bought an existing home).
| Among pre-approved buyers, reasons for getting pre-approved | Total Buyers | New Construction | Existing Home |
| To know my budget | 39% | 39% | 39% |
| To be ready to make an offer at a moment’s notice | 50% | 44% | 52% |
| I found a home and wanted a pre-approval to make an offer | 37% | 44% | 34% |
| Another reason (please specify) | 1% | 2% | 1% |
Among existing home buyers that financed with a mortgage, offering the lowest rate is the clear frontrunner among their top two most important considerations when choosing a lender. Almost two thirds of such existing home buyers (64%) ranked it among their top two. For new construction mortgage buyers, though, recommendation from their real estate agent (52%) tied with offering the lowest rate (52%).
| Mortgage buyers ranked each among their top 2 most important considerations when choosing a lender | Total Buyers | New Construction | Existing Home |
| Lender offers the lowest rate | 58% | 53% | 64% |
| Recommended by my real estate agent, realtor, or broker | 41% | 52% | 37% |
| Guarantee that they will close on time | 38% | 38% | 39% |
| Lender is a prompt communicator | 38% | 34% | 39% |
| Recommended by a friend or family member | 25% | 24% | 22% |
Compared to existing home buyers, new construction buyers are more likely to shop for a lender on a social networking site or app (45% among new construction buyers, versus 32% for existing home buyers) and a financial website or app (50% versus 39%).
| Resources used to shop for a lender | Total Buyers | New Construction | Existing Home |
| Social networking website / app (e.g. Facebook, NextDoor, Twitter, Instagram) | 37% | 45% | 32% |
| Financial website / app (e.g. LendingTree, Quicken Loans, Bankrate.com) | 42% | 50% | 39% |
| Direct mail (e.g. newsletter, flyer, postcard) | 25% | 30% | 19% |
| Newspaper ad | 22% | 27% | 17% |
| Search engine (e.g. Google, Bing) | 55% | 55% | 53% |
| My current financial institution (online / in-person) | 51% | 51% | 50% |
| Another financial institution (online / in-person) | 41% | 44% | 45% |
| Referral from friend, relative, neighbor or colleague | 45% | 44% | 45% |
| Referral from real estate agent, realtor, or broker | 59% | 59% | 62% |
| Real estate website / app (e.g. Zillow, RE/MAX, Realtor.com) | 62% | 55% | 63% |
Among buyers that ultimately financed with a mortgage, where they ultimately found their lender reveals a similar trend: New construction buyers are about twice as likely to report finding their lender on a financial website/app (13% versus 6% of existing home buyers) and also more likely to find them via a social networking site/app (5% versus 2%).
While new construction buyers are less likely to report using a real estate website/app to shop for a lender (55% of new construction buyers reported using one, versus 63% of existing home buyers), both types of mortgage buyers are more likely to ultimately find their lender that way (18% for new construction and 14% for existing home buyers).
| Where mortgage buyers reported first finding the lender they ultimately used to finance their home purchase | Total Buyers | New Construction | Existing Home |
| Financial website / app (e.g. LendingTree, Quicken Loans, Bankrate.com) | 7% | 13% | 6% |
| Social networking website / app (e.g. Facebook, NextDoor, Twitter, Instagram) | 4% | 5% | 2% |
| Real estate website / app (e.g. Zillow, RE/MAX, Realtor.com) | 16% | 18% | 14% |
| Attended an open house and met provider | 1% | 4% | 1% |
| Direct mail (e.g. newsletter, flyer, postcard) | 2% | 2% | 1% |
| Newspaper ad | 1% | 2% | 0% |
| Know them from my community | 4% | 5% | 3% |
| Search engine (e.g. Google, Bing) | 5% | 6% | 5% |
| Saw contact information on For Sale/Open House sign | 4% | 3% | 3% |
| TV/Radio Ad | 2% | 1% | 2% |
| My current financial institution (online / in-person) | 9% | 7% | 9% |
| Another financial institution (online / in-person) | 2% | 2% | 2% |
| Past experience with this provider | 9% | 5% | 12% |
| Referral from friend, relative, neighbor or colleague | 10% | 4% | 12% |
| Referral from real estate agent, realtor, or broker | 19% | 16% | 23% |
| Other | 4% | 4% | 4% |
| None of these | 2% | 3% | 2% |
Rate buydown contingency is more common for new construction buyers
New construction buyers were more likely to say that their final offer was contingent on a mortgage rate buydown (49% among new construction buyers versus 35% of existing home buyers).
In 2023, new construction buyers reported a high likelihood of attending at least one private home tour (88% of new construction buyers and 89% of existing home buyers). They differed from existing home buyers, though, by being more likely to attend at least one open house (69% of new construction buyers versus 59% of existing home buyers) and take a virtual tour (70% versus 59%).
| New construction buyers that agreed somewhat/completely with each statement | 2020 | 2021 | 2022 | 2023 |
| 3D tours would help me get a better feel for the space than static photos | 71% | 71% | 68% | 73% |
| I wish more listings had 3D tours available | 60% | 67% | 67% | 72% |
| I prefer to schedule in-person tours online | 59% | 66% | 68% | 71% |
| It would be easier for me to unlock properties with my phone and tour them in-person on my own time | 64% | 70% | 69% | 72% |
| I wasted time during my home search viewing properties that I would have skipped if I had understood their floorplan before my visit | 56% | 62% | 54% | 54% |
| I’m more likely to view a home if the listing includes a floorplan that I like | 87% | 85% | 85% | 84% |
| The only way to really understand the layout of a home is to see it in person | 77% | 79% | 78% | 83% |
| A dynamic floorplan that shows what part of the home each photo depicts would help me determine if the home is right for me | 74% | 79% | 73% | 80% |
New construction buyers were generally more likely to agree somewhat/completely with most statements compared to existing home buyers:
| Percent of buyers that agree somewhat/completely with each statement | Existing Home Buyers | New Construction Buyers |
| 3D tours would help me get a better feel for the space than static photos | 70% | 73% |
| I wish more listings had 3D tours available | 62% | 72% |
| I prefer 3D tours over in-person viewings | 28% | 49% |
| I prefer to schedule in-person tours online | 64% | 71% |
| It would be easier for me to unlock properties with my phone and tour them in-person on my own time | 66% | 72% |
| I wasted time during my home search viewing properties that I would have skipped if I had understood their floor plan before my visit | 51% | 54% |
| I’m more likely to view a home if the listing includes a floor plan that I like | 81% | 84% |
| The only way to really understand the layout of a home is to see it in person | 80% | 83% |
| A dynamic floor plan that shows what part of the home each photo depicts would help me determine if the home is right for me | 75% | 80% |
New construction buyers were more likely to report using every digital homebuying tool that we asked about, compared to existing home buyers. Using at least one digital option is near-universal for new construction buyers – 91% said they used at least one, compared to 85% of existing home buyers. The most commonly reported digital experience was getting a video tour from a real estate agent (51%) along with signing paperwork online/digitally (49%) and taking a 3D interactive virtual tour (47%).
| Successful buyers that reported each digital tool/experience | Total Buyers | Bought New Construction |
| Real estate agent gave me a video tour | 42% | 51% |
| 3D interactive virtual tour | 37% | 47% |
| Sign paperwork online/digitally | 53% | 49% |
| Use remote or mobile notary options to complete closing | 33% | 38% |
| Unlock properties with my phone and tour them in-person on my own time | 29% | 34% |
| At least one | 89% | 91% |
Regarding digital homebuying experiences, new construction buyers indicated the largest ideal-versus-reality divides when it came to unlocking properties with their phone and touring them in-person on their own time (34% reported taking this kind of tour, versus 48% who say they would ideally do so) and signing paperwork online/digitally (49% reported doing so, versus 54% who said they would ideally sign this way).
| New construction buyers that did or would ideally do | Used | Would ideally use |
| Real estate agent gave me a video tour | 51% | 53% |
| 3D interactive virtual tour | 47% | 49% |
| Sign paperwork online/digitally | 49% | 54% |
| Use remote or mobile notary options to complete closing | 38% | 38% |
| Unlock properties with my phone and tour them in-person on my own time | 34% | 48% |
| At least one | 91% | 93% |
For new construction buyers, confidence making an offer after only seeing a virtual tour of a home, but not touring it in person, remained stable: 67% said they would be at least somewhat confident making such an offer in 2023. For existing buyers, though, the share that said they felt confident rebounded: 49% said they would feel at least somewhat confident in 2023, up from 43% in 2022 but below its 54% pandemic-era peak in 2021.

New construction buyers are more likely to report making at least one offer on a home before viewing the home in person (38% of new construction buyers versus 29% of existing home buyers). However, among buyers that made a sight unseen offer, most say that a spouse or partner (57% of new construction buyers, 44% of existing home buyers), friend or colleague (13% and 10%), family member (26% and 27%), or their real estate agent (27% and 34%) viewed the home before they made an offer.
When accounting for buyers who have someone else visit the home before making an offer, only 4% of new construction and 5% of existing home buyers make an offer entirely unseen.

[1] Because home build year is not included in the Current Population Survey Annual Social and Economic Supplement, weighting for existing home and new construction buyers is based exclusively on the American Community Survey. Buyers as a whole, however, utilizes both CPS and ACS for weighting. In some cases, these differing benchmarks may cause total buyer estimates not to be at the exact population-weighted midpoint of new construction and existing home buyers.
[2] The CHTR survey samples for buyers as a whole (regardless of the new construction or existing home distinction), using both the U.S. Census Bureau’s 2021 American Community Survey (ACS) and 2022 Current Population Survey Annual Economic and Social Supplement (CPS ASEC) for weighting. Unlike the ACS, CPS ASEC does not include the year a buyer’s home was built. Using only the 2021 ACS to benchmark the new construction and existing home buyer samples causes some discrepancies, mostly around age (buyers in the 2022 CPS ASEC trend slightly younger than buyers in the 2021 ACS).
[3] Zillow Group Population Science defines Gen Z as those born between 1995 and 2003, Millennials between 1980 and 1994, Gen X between 1965 and 1979, Baby Boomers between 1945 and 1964, and Silent Generation in 1944 and earlier.
[4] Median household incomes are from U.S. Census Bureau, 2022 Current Population Survey Annual Social and Economic Supplement and 2021 American Community Survey.
