Declining Demand Drives Price Pullback
A sharp retreat in demand for housing has helped drive the market to rebalance – and prices to fall – even as listing activity remains subdued

A sharp retreat in demand for housing has helped drive the market to rebalance – and prices to fall – even as listing activity remains subdued
The housing market is undergoing a swift rebalancing. After two years of double-digit percent increases and 13 consecutive months in which a new all-time record pace was set, national annual home value growth peaked in April and has now slowed for five consecutive months. It may be tempting to conclude this slowdown has been caused by the housing shortage turning into a glut, similar to what happened during the Great Recession 15 years ago. However, an analysis of recent housing market data indicates that it’s been a sharp pullback in demand for housing that is disproportionately responsible for the current slowdown in price growth. Active for-sale inventory rose steadily through the spring and summer but still sits nearly 40% below pre-pandemic levels. Meanwhile, new for-sale listings were down 16% in September compared to a year prior – a similar annual shortfall that was seen in August and in July.
This dynamic is unlike previous housing market slowdowns that led to price declines, and persistent tight supply could insulate the market from a significant price correction, even as demand has fallen off. For instance, in the Great Recession home value declines were accompanied/prompted by an increase in new listings, including many distressed sales.
The increase in inventory despite a sharp slowdown in new listing activity suggests that active demand for housing has fallen sharply. Put simply, sales – flows out of the pool of available inventory – have decreased by more than the decline in the number of new homes coming on the market, allowing the overall stock of available for-sale inventory to increase.
There are many variables that affect housing supply and demand – income, interest rates, etc. – and ultimately home prices depend on the number of active home shoppers and the number of available homes for those shoppers to select from. But quantifying demand is challenging due to the fact that we cannot observe it directly.
A standard matching model [1] – as in the one shown in a recent paper by Anenberg and Ringo – is one method in which to estimate recent changes in demand for housing amid changing market conditions. The model – which leverages not just inventory levels, but the flows of inventory into and out of the market – disentangles whether the pandemic frenzy and the current housing market slowdown were caused by a demand freeze or supply surge.
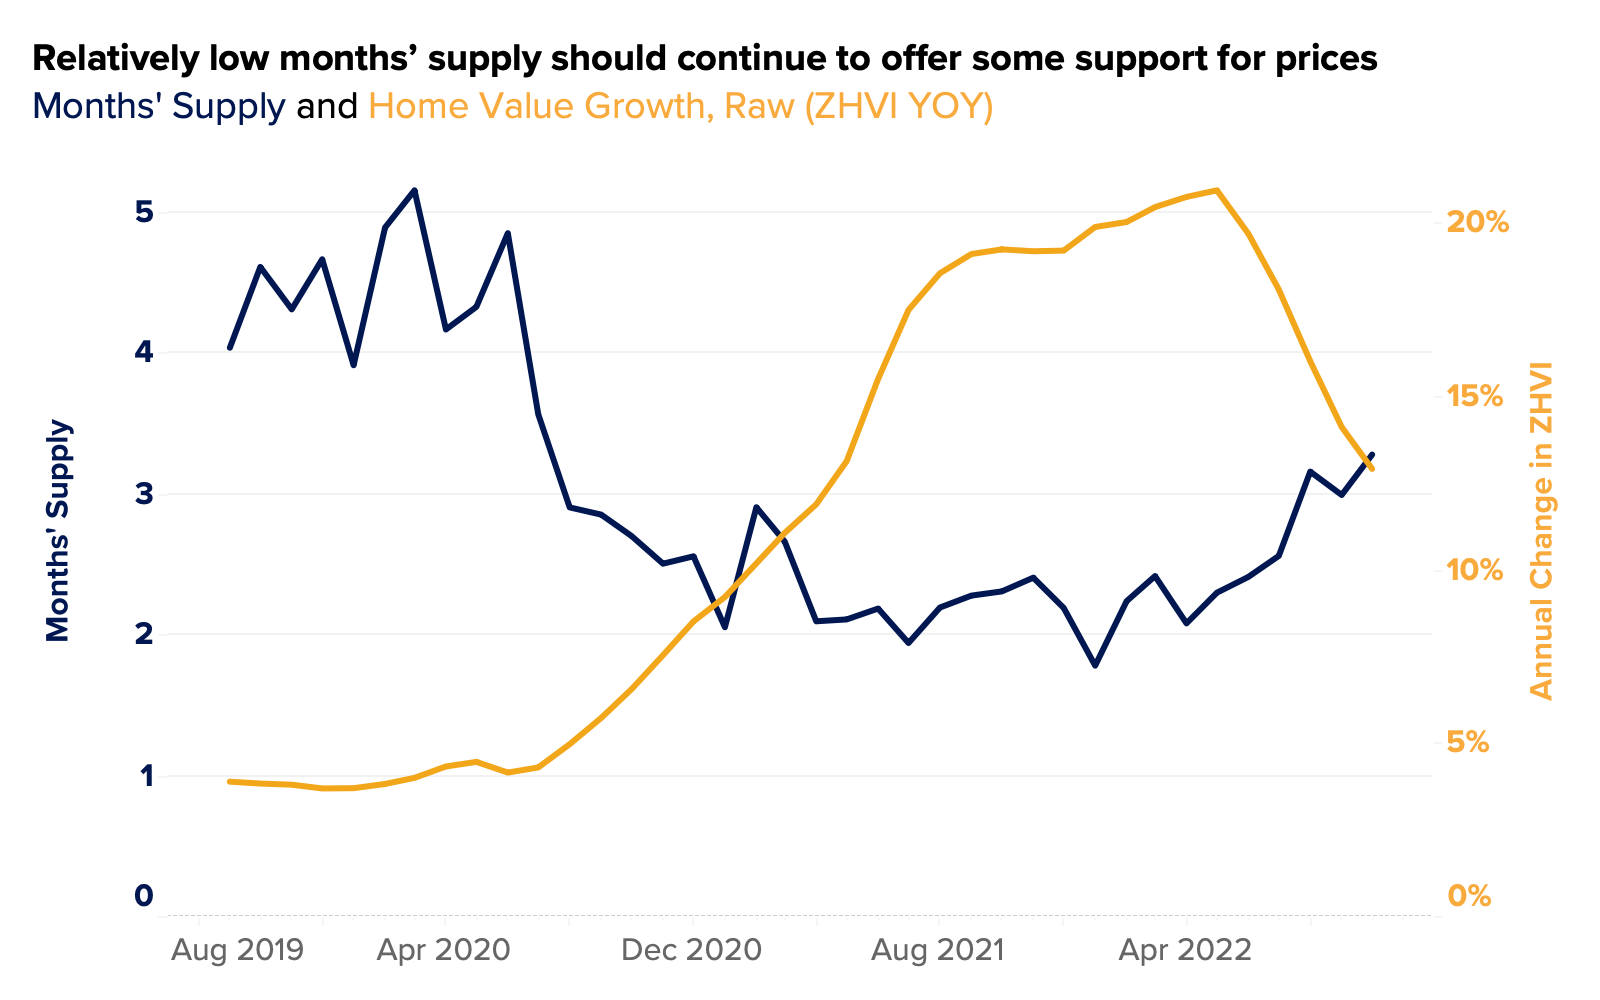
A pullback in demand has pushed prices downward, but while the housing market isn’t nearly as tight as it was earlier, a lack of for-sale listings is providing some support for prices against further declines. Months’ supply — a gauge of market tightness which measures how long it would take for all active for-sale listings to sell, given the current volume of sales – has increased by 29 days when compared to a year ago but remains well below pre-pandemic levels, still down 40 days when compared to September 2019. A recent paper from the Federal Reserve board suggests that months’ supply explains 80% of the variation in house price growth – an increase in the metric tends to slow price growth, and vice versa. This has certainly held true recently, but while price growth has stalled or reversed in most U.S. markets, relatively low months’ supply should continue to offer some support for prices, at least in the near-term.
Until recently, a surge in home buying demand had pushed sales and prices higher and higher. Competition among buyers resulted in bidding wars that pushed price increases into unprecedented annual growth territory.
During the pandemic, housing inventory fell in most US metropolitan areas in part because home buying demand surged with changing demographics and record low interest rates. The result was a large increase in sales that consistently outpaced the flow of listings coming on the market. Supply, as captured by the flow of new listings coming on the market, failed to keep up with persistent increases in home buying demand.
The increase in the number of potential new buyers relative to the stock of housing for sale raised the likelihood that a seller would find a buyer. As a result, the time it took for the typical home to sell decreased and the stock of available housing was not replenished quickly enough. Months’ supply fell rapidly. And with all that pressure, prices increased.
Since then, sharp mortgage rate increases – brought upon by tighter monetary policy and other factors – coupled with record home price growth and lagging income growth have pushed housing affordability to an all time low, forcing the housing market to downshift.
Across the country, affordability challenges have pushed potential buyers to the sidelines. Of course, this demand destruction has been more pronounced in some markets than in others. Markets with the highest prices a year ago saw disproportionately larger declines in active demand in the 12 months that followed.
Markets like Boise City, ID (-54.7%), Austin, TX (-52.7%), Phoenix, AZ (-60.5%), Las Vegas, NV (-55.4%), which all saw substantial home price increases during the pandemic’s first couple years, as well as some Florida markets like Fort Myers (-44.3%) and Jacksonville (-45.6%), have seen a disproportionate pullback in demand amid worsening affordability. In markets like these, houses are staying on the market longer, allowing inventory to grow more rapidly than in other markets and placing more downward pressure on prices.
Other major markets have seen a much smaller pullback – or in a couple cases, even an increase – in buyer demand compared to a year ago. In New Orleans, LA, demand for homes was 16% stronger in September compared to the previous year, and demand for homes in Richmond, VA rose 9% over that same period. Syracuse, NY (-8.9%), Toledo, OH (-10.2%), Pittsburgh, PA (-12.7%) and Buffalo, NY (-13.9%) all saw modest declines in demand from a year ago., Rochester, NY (-15.3%), Madison, WI (-18.4%), Mc Allen, TX ( -18.8%), Allentown, PA (-19.2%). Perhaps it is also worth pointing out that New Orleans, LA is the only metropolitan area in the country to see both an increase in demand and supply – new listings – when compared to a year ago.
In the past 12 months, house price growth declined least in areas that saw the smallest increase in months’ supply. These are markets with a lesser pullback in demand relative to the retreat in new listings. On one hand, falling demand acts to bring down prices. On the other hand, falling supply puts upward pressure on prices. Although housing demand fell sharply over the past year, demand remains elevated relative to available inventory for-sale in comparison to the pre-pandemic period.
While we can directly track the changes in the number of houses that are for sale, we do not directly observe the number of individuals who are currently searching for a home. However, data on new listings, for-sale inventory and sales can help us infer changes in homebuyer demand (see Anenberg and Ringo, 2022)
As in Anenberg and Ringo (2022), we define supply as the monthly flow of homes coming onto the for-sale market: new listings. The total inventory of homes for sale is a function of:
Available inventory evolves according to the following equation:
![]()
The stock of houses available for sale at the start of the next period is the stock this period net of the outflow of units arising from sales and withdrawals plus the inflow of new units.
Demand is defined as the flow of prospective buyers that enter the market each month as well as those who exit the market or find a home. Similarly to the supply of homes for sale, there exists a stock of currently-searching buyers that evolves according to:
![]()
Where ![]() is the net inflow of new buyers and outflow of discouraged buyers. The stock of buyers who are searching for a unit is being replenished by an inflow of new buyers and depleted as buyers either find a home or become discouraged and exit the market.
is the net inflow of new buyers and outflow of discouraged buyers. The stock of buyers who are searching for a unit is being replenished by an inflow of new buyers and depleted as buyers either find a home or become discouraged and exit the market.
Supply and demand interact via the search and matching process, which is modeled as Cobb Douglas with constant returns to scale. Under Cobb-Douglas, the probability that a unit sells is:
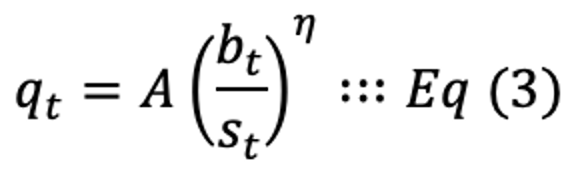 The rate of home sales q is determined by the market tightness
 ![]() and a technology parameter
and a technology parameter ![]() that determines the efficiency of the matching function. The parameter
that determines the efficiency of the matching function. The parameter ![]() is the elasticity of the probability of a sale with respect to market tightness – in other words how sensitive the probability of a sale is to the market tightness. The more interested buyers for each house there are in the market, the faster the house is likely to sell and
is the elasticity of the probability of a sale with respect to market tightness – in other words how sensitive the probability of a sale is to the market tightness. The more interested buyers for each house there are in the market, the faster the house is likely to sell and ![]() is an increasing function of market tightness.
is an increasing function of market tightness.
Plugging equation (3) into equation (2) and rearranging, we can express the net flow of new buyers as:
![]()
The net flow of new buyers depends only on variables that can be directly observed.
Using Zillow data for new listings, for-sale inventory, sales, and calibrated with Anenberg and Ringo (2022) estimates for matching efficiency and the elasticity of sales with respect to market tightness (![]() =1.4,
=1.4, ![]() =0.84), we can back out an estimate for the number of buyers that are currently on the market.
=0.84), we can back out an estimate for the number of buyers that are currently on the market.
For the full discussion on the choice of the model’s parameters, see Anenberg and Ringo (2022)[i].
[i] Elliot Anenberg and Daniel Ringo (2022) “Volatility in Home Sales and Prices: Supply or Demand?, “ Finance and Economics Discussion Series 2022-041. Washington: Board of Governors of the Federal Reserve System, https:
