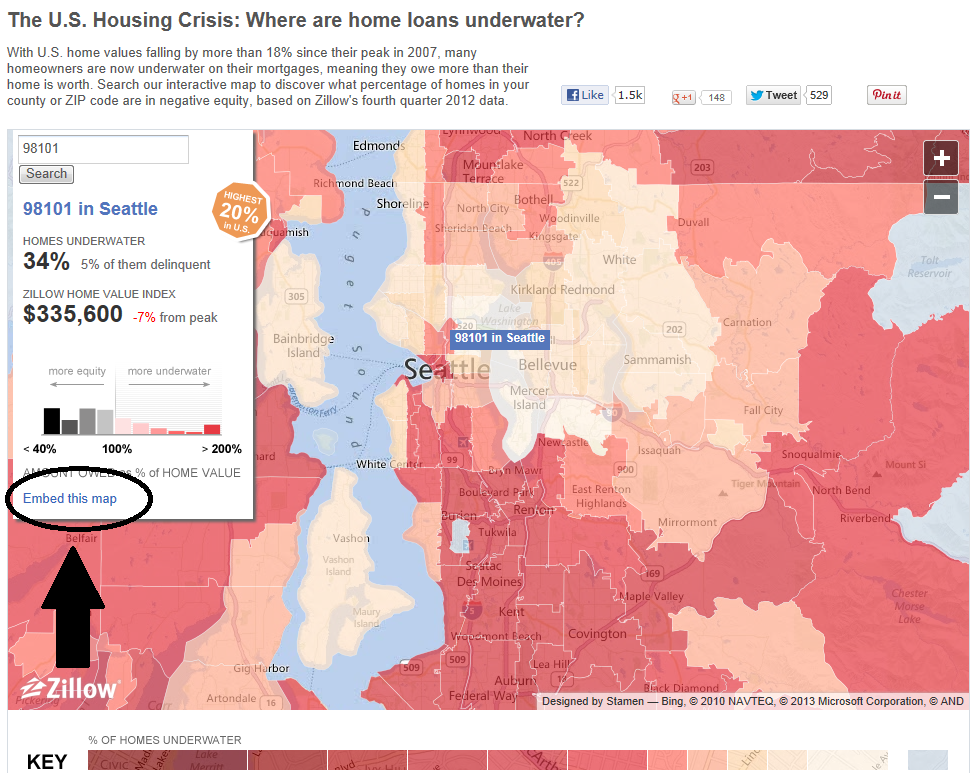
Last week we released our fourth quarter negative equity report. With that, we also updated our negative equity visualization, which can be found here . New this time around is that we added the feature to be able to embed a certain map view on other sites. On the visualization click on “Embed this map” – shown below by the large black arrow and circle – and then a popup will let you choose the exact view you want to embed.
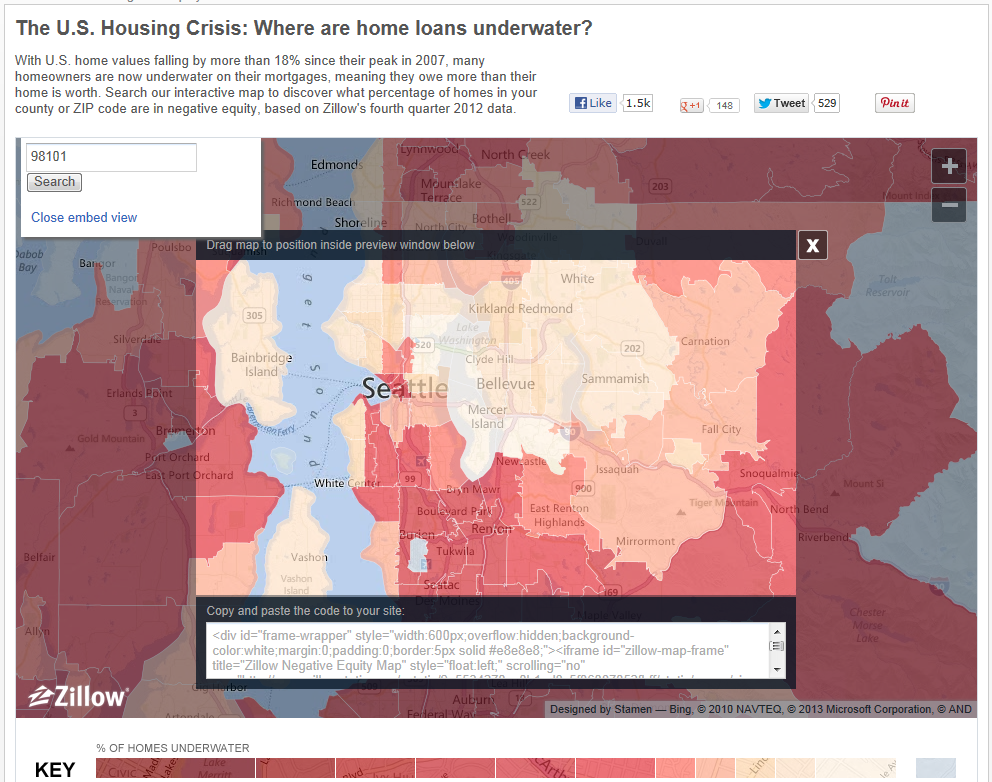
Now, center the area you would like to embed within the box:
The result is below – check it out and enjoy!
