Embedding Negative Equity Maps
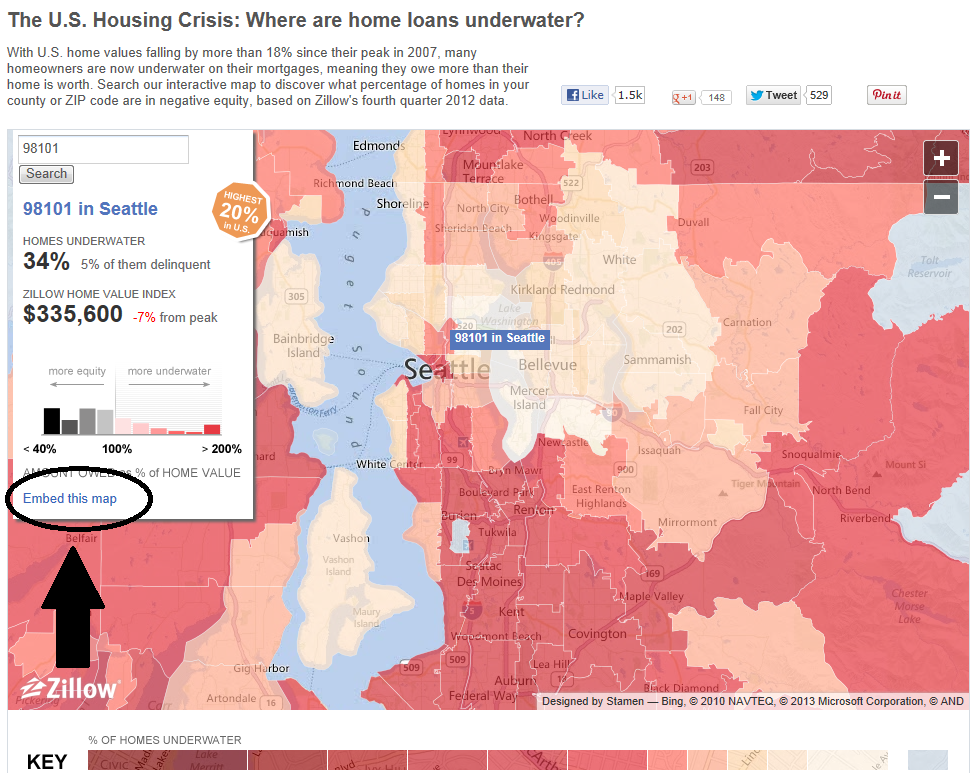
Last week we released our fourth quarter negative equity report. With that, we also updated our negative equity visualization, which can be found here . New this time around is that we added the feature to be able to embed a certain map view on other sites. On the visualization click on “Embed this map” – shown below by the large black arrow and circle – and then a popup will let you choose the exact view you want to embed.
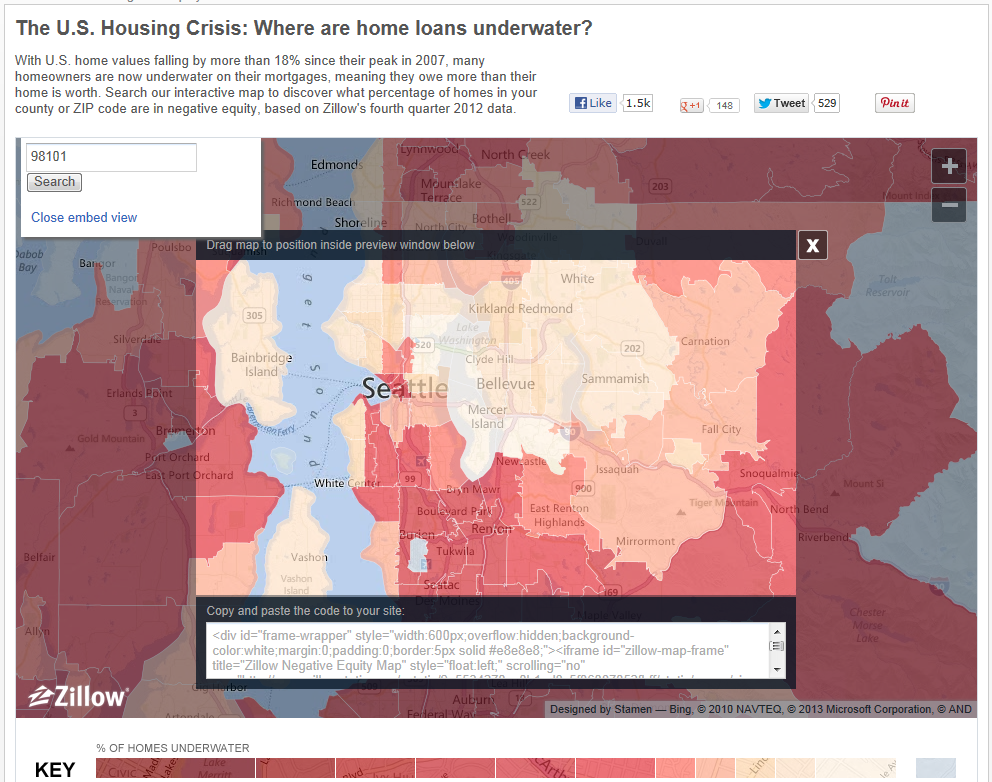
Now, center the area you would like to embed within the box:
The result is below – check it out and enjoy!
Sign up for Zillow Research updates
Subscribe to receive weekly emails for the latest Zillow research, weekly housing data, market insights and more.
Related Articles



Research in your inbox
Get the latest housing data and analysis from Zillow's economists — delivered when the numbers update.

