Millions of Tenants Remain Behind on Rent, but Their Confidence is Rising
On the eve of the scheduled expiration of the federal eviction moratorium, some 3 million U.S. tenants are at risk of losing their home.

On the eve of the scheduled expiration of the federal eviction moratorium, some 3 million U.S. tenants are at risk of losing their home.
Editor’s Note (updated July 28, 2021): In advance of the scheduled expiration of the federal evictions moratorium on July 31, Zillow Research re-ran the numbers in the story below using the most recent data available as of July 28. More than 7.4 million U.S. households were behind on rent at the time, according to the Census Household Pulse Survey (HPS), about 326,000 more than in June. About 3 million of those were at risk of eviction and — though there is much uncertainty around what will happen once the eviction moratorium officially ends — fewer still will actually be evicted. With additional uncertainty about what will happen, Zillow currently estimates there will be about 481,630 eviction filings after the moratorium ends, with a projected 261,945 likely to be evicted. View methodology here.
……………….
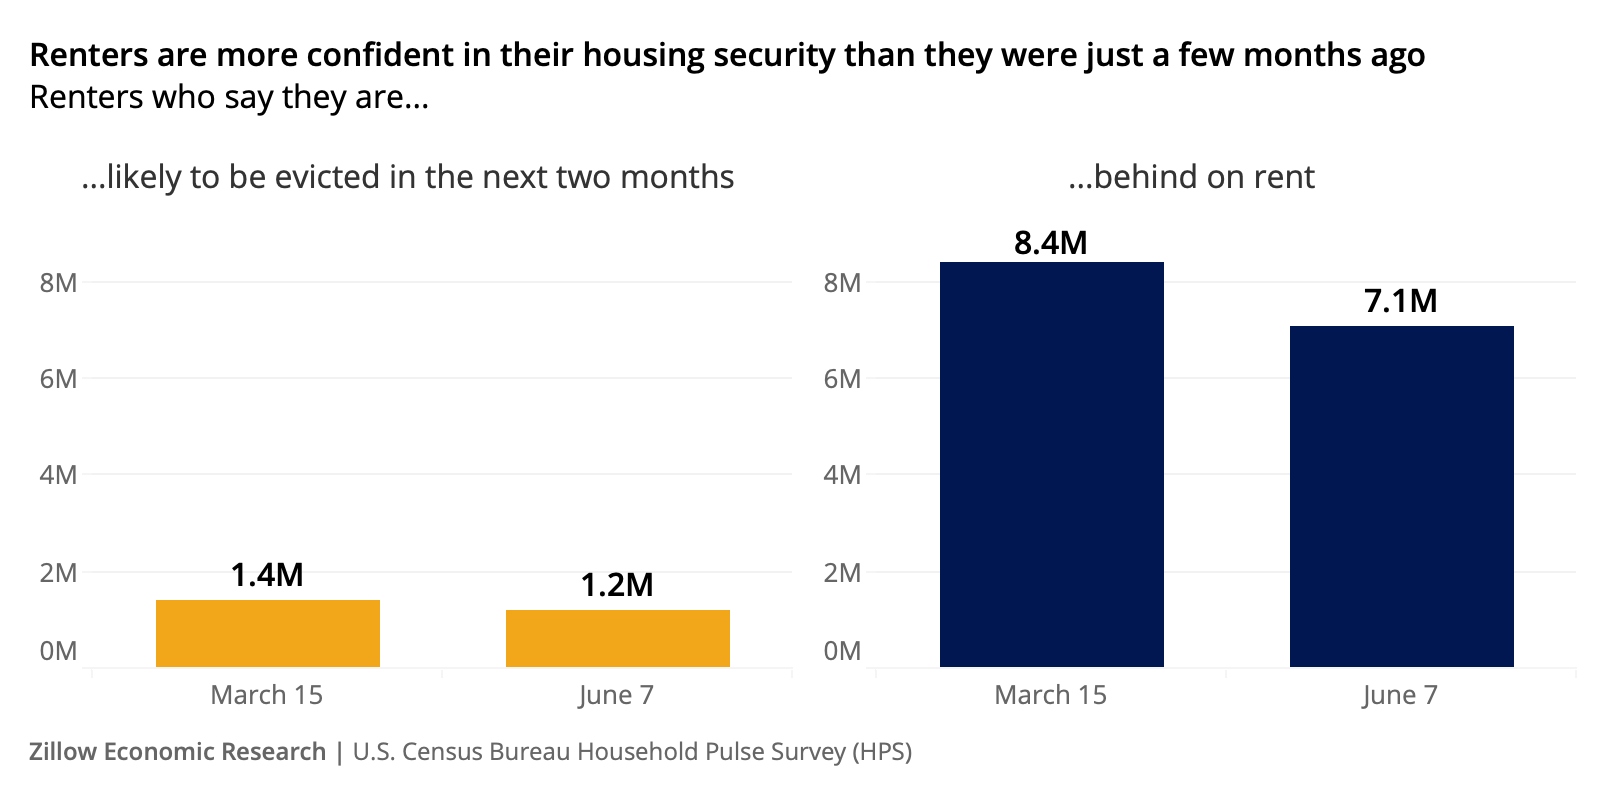
More than 7 million U.S. renter households are currently behind on rent, according to the U.S. Census Bureau, an eye-popping number that nevertheless obscures the fact that renters have also grown more confident in their housing security over the past few months.
Zillow estimates that the number of renters truly at risk of eviction is much lower than the number that report being behind on rent, and fewer still will actually be evicted – especially after news that a federal eviction moratorium set to expire on June 30 has been extended another month to July 31. Prior to the announcement of the extension, we estimated that 2.7 million renter households were at risk of eviction, based on an analysis of Census Household Pulse Survey (HPS) data and data from the Eviction Lab’s Eviction Tracking System. When the moratoria do eventually expire, the number of renters that ultimately do get evicted will depend on the pace of the economic recovery and individual landlord choices.
There is no historical precedent to the current moment, and very little relevant data to precisely map out the path forward. Additionally, because there is a limited historical baseline between HPS data (which only begins at the start of the pandemic) and eviction filings, any forecast must reflect the very uncertain nature of the situation. But assuming landlords in all states evict at the same rate as the 5 states tracked by the Eviction Lab during Covid-19, our pre-extension analysis suggested there was a 95% probability that the total number of eviction filings would be between 144,000 and 264,000 in July and August, with an average of 205,000. For context, there were 2.35 million eviction filings nationwide in 2016 (the most recent year for which complete data is available from the Eviction Lab), an average of 392,000 every two months. The baseline estimate of 205,000 is roughly half of the 2016 filings benchmark, suggesting that the moratoria have worked to keep people in their homes throughout the pandemic.
Adding additional uncertainty to reflect the fact that landlords in all states will not behave like the five for which we have data, the pre-extension prediction for the number of likely evictions (and the amount of uncertainty) increased: A 95% probability that the number of national eviction filings will be between 173,000 and 927,000 in July and August. The average number of filings in this new simulation would have been 437,000 over two months, or 11.5% higher than the 2016 filings benchmark.
Again, those numbers are not easily dismissed, but renters themselves are also more confident in their housing security than they were just a few months ago. In the HPS ending March 15, there were 8.4 million renters who said they were behind on their rent and 1.41 million that believed they were very likely to be evicted in the next two months. In the HPS ending June 7, there were 7.1 million renters that reported being behind on their rent, and 1.2 million that believed they were likely to be evicted within 60 days — a decline of more than 200,000 tenants that said they believed eviction was imminent. This improved outlook among renters is reflected in our eviction estimates. In March, our estimates produced an average of 284,000 (baseline) and 577,000 (added uncertainty) eviction filings in May and June, compared to the 205,000 (baseline) and 437,000 (added uncertainty) expected for July and August.
Increased renter confidence in their own housing security could be attributed to a number of factors. Eviction moratoria have certainly worked to keep people in their homes during the pandemic, and rental assistance programs have likely improved the outlook for some renters as well — more than $45 billion in rental assistance has been approved by the federal government in recent stimulus packages. And after a year in which rents overall stayed largely flat in response to the pandemic, the rental market itself appears to be regaining its footing: Rents nationwide increased 2.3% from April to May — the largest monthly appreciation since 2015.
The Centers for Disease Control and Prevention has indicated that this extension to the moratoria – which was initially set to expire in March, before being extended to June and then again through July – will in all likelihood be the last. This gives renters and landlords notice that evictions are much more likely after July 31 once protections expire, offering some sobering but necessary certainty on the path forward and an opportunity to plan more clearly for what comes next. And while it’s clear the outlook has improved since March, it is still quite likely that the number of evictions post-moratorium will be elevated relative to historic norms. However, a large-scale eviction crisis remains avoidable, and continued recovery and reopening of the economy, targeted distribution of aid to the most vulnerable renters and the potential for structured repayment plans with landlords will likely keep many distressed renters in their homes.
| Region | Number of Households Behind on Rent |
Number of Households at Risk of Eviction |
Number of Likely Eviction Filings After Moratorium Ends |
Number of Households Likely To Be Evicted |
|---|---|---|---|---|
| United States | 7,433,895 | 3,048,516 | 481,630 | 261,945 |
| Alabama | 90,621 | 45,490 | 7,375 | 3,076 |
| Alaska | 16,459 | 4,127 | 705 | 369 |
| Arizona | 138,492 | 63,537 | 10,342 | 3,962 |
| Arkansas | 66,315 | 22,721 | 3,547 | 1,973 |
| California | 1,034,410 | 491,665 | 74,283 | 63,703 |
| Colorado | 91,578 | 48,448 | 7,894 | 4,619 |
| Connecticut | 84,891 | 22,572 | 3,524 | 2,657 |
| Delaware | 7,942 | 3,337 | 560 | 28 |
| District of Columbia | 28,927 | 12,962 | 2,030 | 950 |
| Florida | 357,194 | 144,220 | 22,411 | 12,376 |
| Georgia | 341,794 | 159,651 | 26,405 | 8,182 |
| Hawaii | 23,423 | 8,459 | 1,357 | 1,243 |
| Idaho | 15,504 | 7,595 | 1,184 | 484 |
| Illinois | 252,800 | 85,613 | 13,079 | 6,939 |
| Indiana | 100,129 | 27,620 | 4,746 | 2,860 |
| Iowa | 54,187 | 22,282 | 3,711 | 2,491 |
| Kansas | 27,642 | 14,629 | 2,299 | 1,698 |
| Kentucky | 79,510 | 39,946 | 6,485 | 3,722 |
| Louisiana | 97,810 | 49,531 | 7,946 | 4,048 |
| Maine | 24,483 | 8,411 | 1,314 | 825 |
| Maryland | 144,237 | 59,808 | 9,593 | 261 |
| Massachusetts | 127,814 | 31,507 | 5,003 | 4,640 |
| Michigan | 120,842 | 65,686 | 11,016 | 4,898 |
| Minnesota | 42,445 | 9,147 | 1,411 | 637 |
| Mississippi | 100,519 | 56,256 | 8,983 | 5,474 |
| Missouri | 97,670 | 46,617 | 7,241 | 4,447 |
| Montana | 6,595 | 701 | 116 | 75 |
| Nebraska | 42,309 | 17,929 | 2,758 | 2,346 |
| Nevada | 62,490 | 22,158 | 3,551 | 1,299 |
| New Hampshire | 33,416 | 16,915 | 2,759 | 249 |
| New Jersey | 232,366 | 105,873 | 16,392 | 9,965 |
| New Mexico | 39,831 | 19,693 | 3,063 | 511 |
| New York | 862,337 | 173,441 | 27,852 | 10,653 |
| North Carolina | 209,675 | 50,413 | 7,843 | 5,139 |
| North Dakota | 14,650 | 5,678 | 876 | 626 |
| Ohio | 213,406 | 105,007 | 16,695 | 8,807 |
| Oklahoma | 86,009 | 46,463 | 7,393 | 4,426 |
| Oregon | 93,704 | 30,511 | 4,764 | 2,174 |
| Pennsylvania | 402,928 | 157,352 | 26,905 | 11,465 |
| Rhode Island | 27,081 | 7,383 | 1,205 | 945 |
| South Carolina | 197,903 | 115,020 | 18,227 | 3,750 |
| South Dakota | 23,576 | 10,448 | 1,675 | 648 |
| Tennessee | 197,283 | 73,020 | 11,515 | 5,352 |
| Texas | 619,061 | 336,479 | 50,810 | 23,718 |
| Utah | 44,574 | 12,183 | 1,958 | 952 |
| Vermont | 4,919 | 1,544 | 256 | 102 |
| Virginia | 119,126 | 50,621 | 8,306 | 8,176 |
| Washington | 220,059 | 96,649 | 15,609 | 8,682 |
| West Virginia | 26,081 | 10,908 | 1,710 | 1,100 |
| Wisconsin | 77,889 | 27,284 | 4,459 | 3,910 |
| Wyoming | 8,992 | 3,005 | 492 | 312 |
