Highly ‘Favorited’ Homes on Zillow Sell Faster and for More Money
Favorites are a leading indicator of market competitiveness: Homes that accumulate the most favorites -- in the 80th percentile of their metro or higher – sell faster than 64 percent of the homes in their area. Those same highly favorited homes sell for a higher sale-to-list-price ratio than most other homes in their metro area.
- Listings that receive more favorites on Zillow sell faster and for more money.
- Listings in San Jose, Calif., San Francisco, Seattle, Portland, Ore., Dallas, and Detroit receive the most Zillow favorites their first week on market.
- Listings in the city of Seattle are typically more competitive than listings in the rest of its metro — whereas listings in the outlying areas of the Detroit metro area are more competitive than those in the city itself.
As soon as listings go live, users start to “favorite” them on Zillow. Favoriting a home shows more intent than just browsing: It’s a way for people to catalog listings so they can return to or share them with someone later. Our new research shows that listings with lots of favorites signal greater competitiveness in the market, typically selling faster and more frequently above their initial list prices.
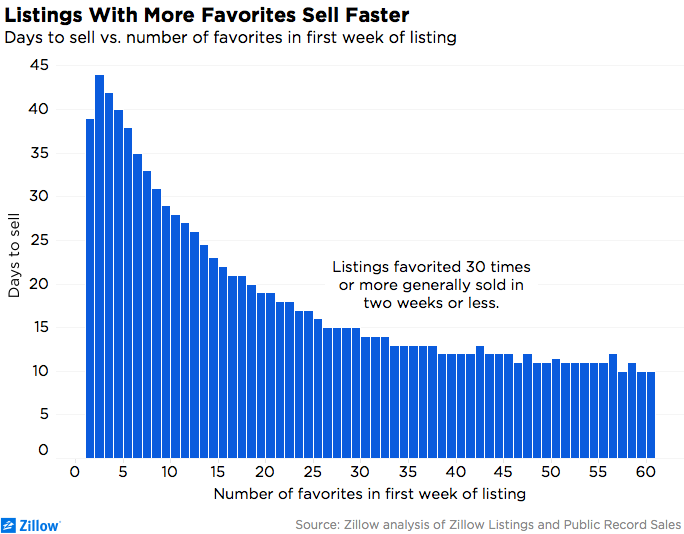
A listing that accumulates 30 or more favorites during its first week on the market will be snapped up in fewer than two weeks[1], on average. Compare that to listings that receive 10 or fewer favorites in their first week on market: They take a month or longer to sell, on average.
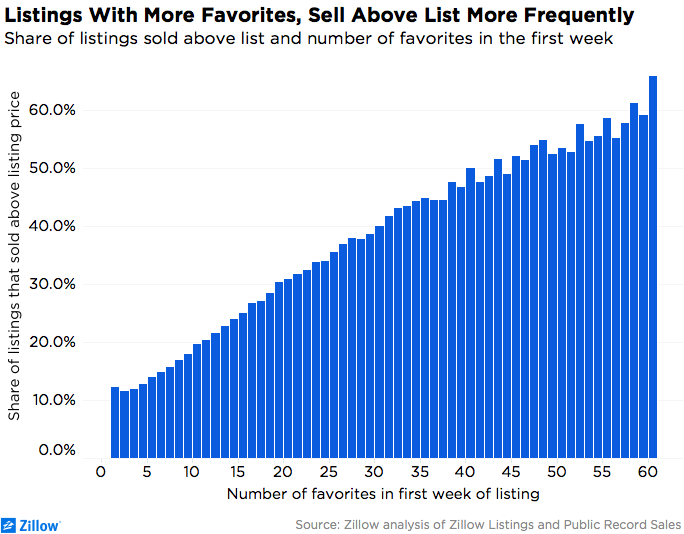
Selling above list price shows exactly the same relationship. More than 50% of homes that receive 40 or more favorites during their first week on market (a rare occurrence in most markets) sell above their initial list prices. Only 10 percent to 20 percent of homes with fewer than 10 favorites sell above their list prices.
Within metro areas, the same trends hold. Homes that accumulate the most favorites — in the 80th percentile of their metro or higher – sell faster than 64 percent of the homes in their area. Those same highly favorited homes sell for a higher sale-to-list-price ratio than most other homes in their metro area.
This makes favorites a leading indicator of market competitiveness. Before we see what a home sells for and how long it takes, we can see how many people express interest in the listing by favoriting it – and bringing all the favorites from various metros’ listings together creates a strong signal for how competitive certain housing markets are.
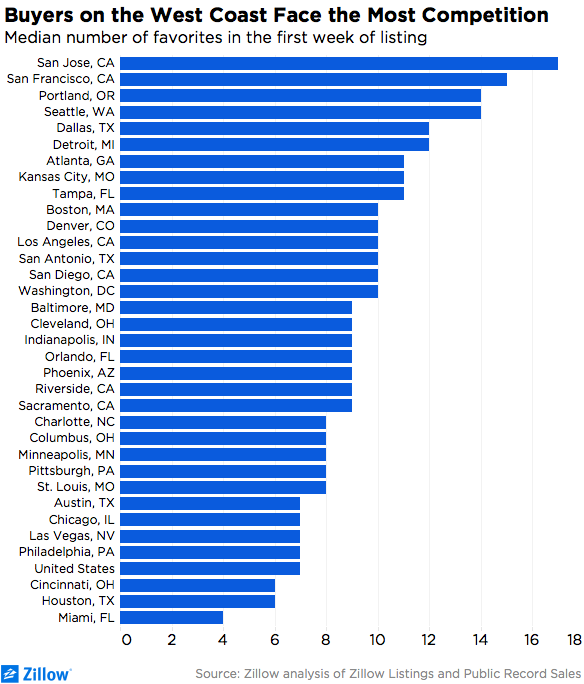
The usual suspects top the list: In the pricey Bay Area, Portland, Ore., and Seattle, the median number of favorites for listings during this year’s spring selling season was between 14 and 17. Among the next six markets (Dallas, Detroit, Atlanta, Kansas City, Tampa, Fla., Boston and Denver), all but Kansas City experienced home-value growth that’s faster than the nation (and home values nationally are growing at a historic rate).
Within metros, there’s a wide spread in how many favorites various listings receive. In San Jose, Calif., for example, roughly the same number of listings received three first-week favorites during the selling season this year as listings that received 24 favorites. That’s a large difference!
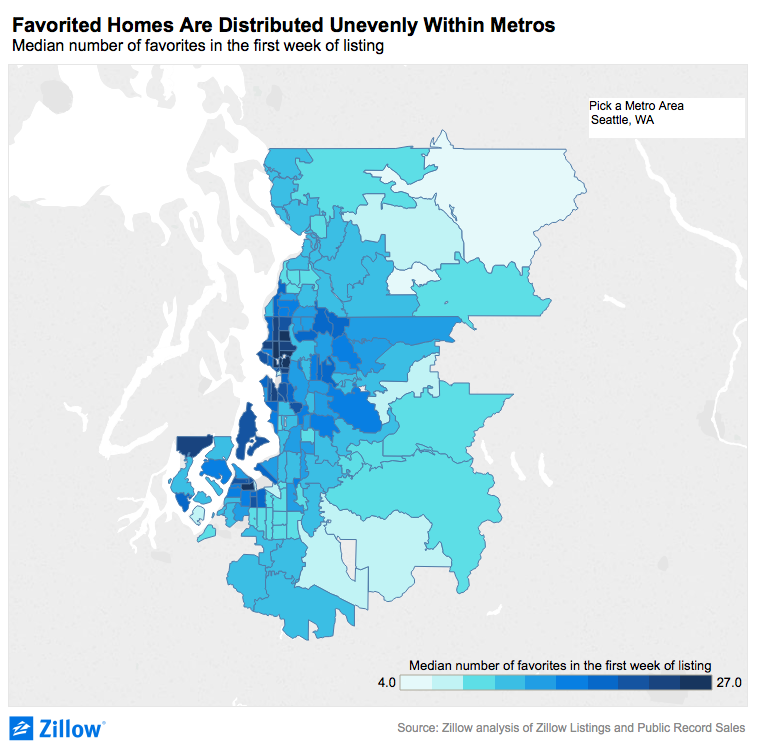
Given the large variation within metro areas, it makes sense to compare listings that are closer together, for example at the city level. The median listing in the city of Seattle received 22 favorites in its first week on market, whereas listings outside the city received only 13 favorites –41 percent fewer). Seattle’s 9 favorite difference between city-proper and the rest of the metro, represented the largest gap amongst the largest 50 metro areas. At the opposite end of the spectrum, the outlying areas of the Detroit metro gained 63 percent more favorites than listings in the city itself (13 favorites for outlying areas and 8 for the city itself). Some combination of more desirable homes, more active home shoppers, and more constrained inventory in the outlying area account for the difference.
See how competitive listings are by ZIP code:
We’ve started providing this information to our new construction partners via our Builder Inform tool. We hope it empowers home builders by giving them more housing data to better inform their decisions. Favorites is one of several measures we include in the tool, computed by region and aggregated by different types of homes, so builders can understand which types of homes are in short supply and therefore can support new inventory.
Related:
[1] To compute days to sell we computed the number of days between a home getting listed and an offer being accepted (or in other words the home going pending). Typically homes take another month or longer to actually close.

