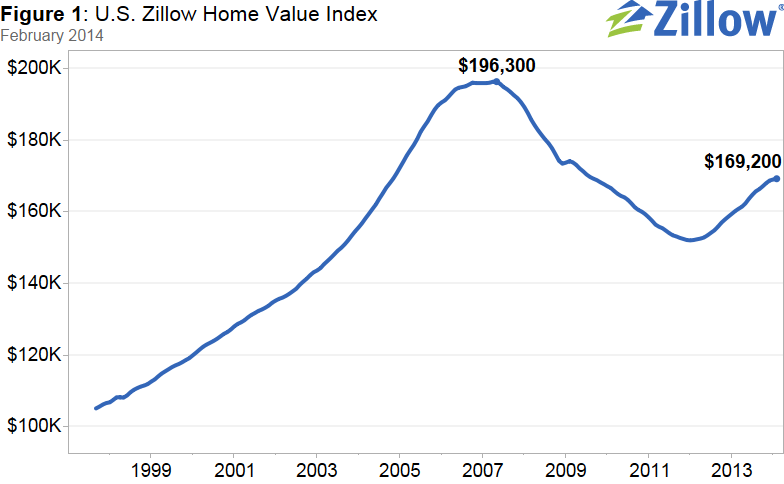
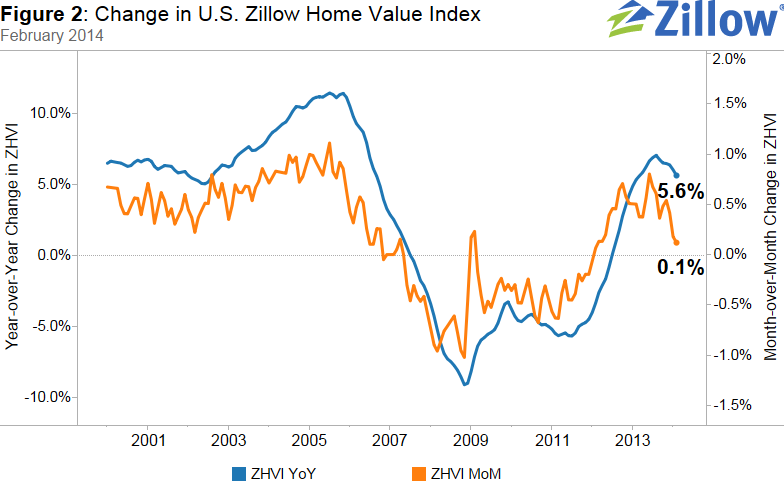
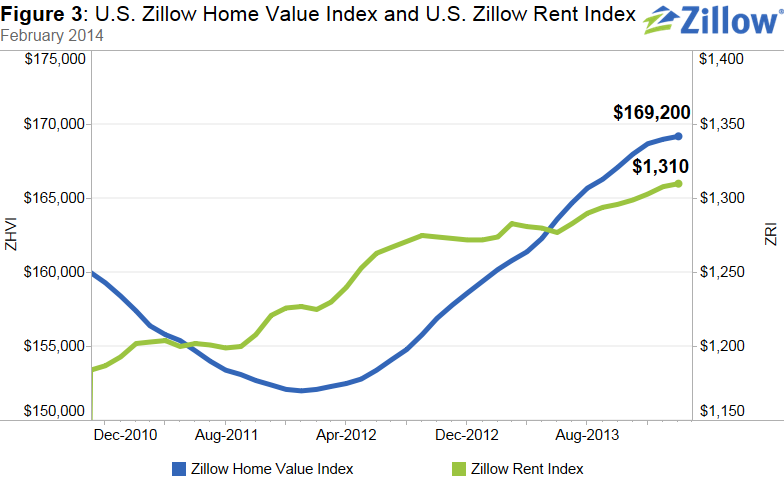
Zillow’s February Real Estate Market Reports, released today, show that national home values rose 0.1 percent from January 2014 to February 2014 to $169,200 (Figure 1). On a year-over-year basis, home values were up 5.6 percent (Figure 2) from February 2013. The last time national home values were at this level was in November 2004. Rents were up 2.8 percent on a year-over-year basis (Figure 3). The Zillow Home Value Forecast calls for 3 percent appreciation nationally from February 2014 to February 2015 – roughly half the appreciation we saw in 2013.
Many markets are experiencing above-normal rates of home value growth. Among the nation’s 35 largest metros, all but St. Louis experienced year-over-year home value increases in February. Those with the most notable annual increases in January include Riverside (25.0 percent), Las Vegas (24.9 percent), Sacramento (19.5 percent) and Orlando (18.4 percent).
But even as homes continue to appreciate in value, we continue to see slowdowns in metros across the U.S. The slowing in home value appreciation can in large part be attributed to increasing for-sale inventory levels. In February, inventory rose year-over-year by 5.5 percent in the nation, despite remaining low overall. The majority of metros also saw an increase in inventory levels on an annual basis. With buyers having more homes to choose from and being less apt to engage in bidding wars, home value appreciation will continue to slow into 2014. This means that some markets will become more favorable for buyers this year, or at least relatively more favorable compared to 2013. In terms of negotiating power, sellers in the West will likely have the upper hand in negotiations when selling their home, while buyers in Midwestern and East Coast metros will likely face less competition and have more room for bargaining on prices.
Home Values
The February Zillow Real Estate Market Reports cover 514 metropolitan and micropolitan areas. In February, 293 (57 percent) of the 514 markets showed monthly home value appreciation, and 426 (82.9 percent) of the 514 markets saw annual home value appreciation. Among the 35 largest metro areas covered by Zillow, four exhibited monthly depreciation in February. The biggest declines were in Kansas City (-0.8 percent) and Phoenix (-0.5 percent). Overall, national home values are still down 13.8 percent from their peak in April 2007.
Rents
The Zillow Rent Index (ZRI) covers 846 metropolitan and micropolitan areas and shows year-over-year gains for 634 metropolitan areas covered by the ZRI. Currently national rents are up 2.8 percent year-over-year. Large markets that saw extremely strong annual rent appreciation include Cincinnati (10.2 percent), Pittsburgh (10 percent), Seattle (8.0 percent) and Denver (7.6 percent).
Inventory
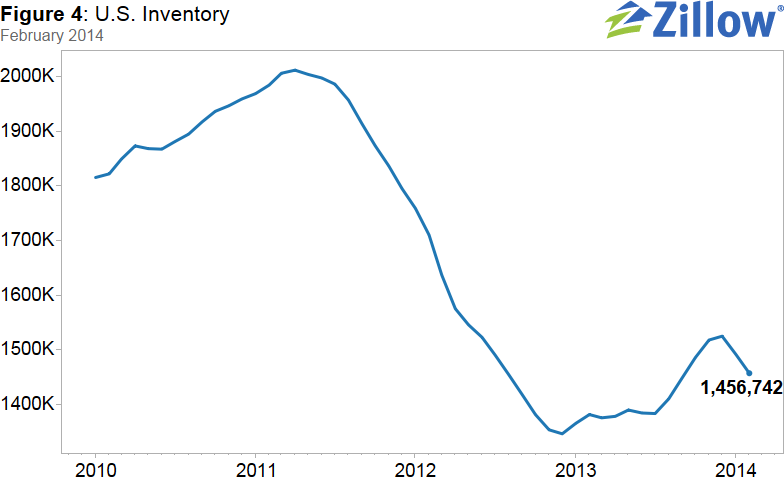
Nationwide, the number of homes listed for sale on Zillow was up 5.5 percent annually in February on a seasonally adjusted basis, the sixth straight month in which inventory has risen year-over-year (see Figure 4). Inventory rose on an annual basis in 461 of the 648 metros Zillow covers with inventory data. Despite broadly increasing inventory levels, in most metros inventory is still not back to normal levels. As a result, we will still likely see bidding wars over what inventory is available in 2014, but probably much less than in 2013. These conditions significantly favored sellers in 2013. Buyers will find themselves with more negotiating power this year, but many regions in the US are still dominated by seller markets. In our January Buyer-Seller analysis, we found that sellers in the West will likely have the upper hand in negotiations when selling their home, while buyers in Midwestern and East Coast metros will likely face less competition and have more room for bargaining on prices. In this analysis, a sellers’ market is not necessarily one where home values are rising, but rather one in which homes are on the market for a shorter time, price cuts occur less frequently and homes are sold at prices very close to (or greater than) their last listing price. In buyers’ markets, homes for sale stay on the market longer, price cuts occur more frequently and homes are sold for less relative to their listing price.
Foreclosures
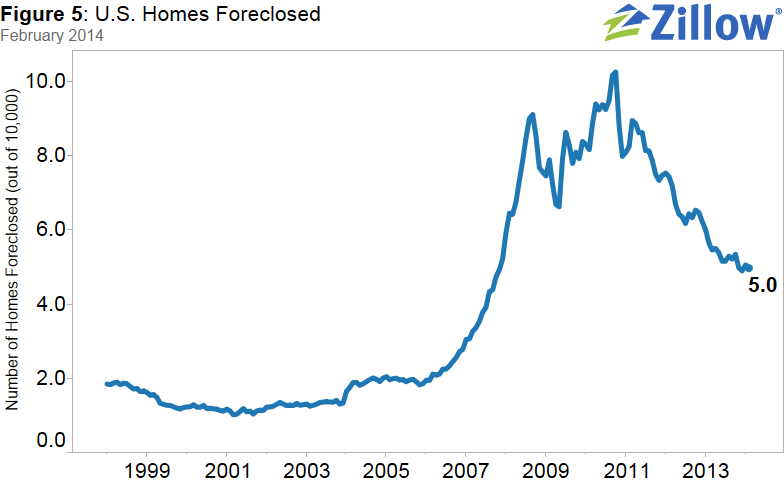
The rate of homes foreclosed continued to decline in February, with 4.97 out of every 10,000 homes in the country being liquidated. The last time it was at this rate was in December 2007. Nationally, foreclosure re-sales also continued to fall, making up 10.5 percent of all sales in February (Figure 5). This is down 0.5 percentage points from February 2013. The foreclosure pipeline is slowly being cleared out; however, judicial foreclosure states, such as New York, New Jersey and Connecticut, are much slower in clearing the foreclosed home backlog.
Outlook
Home value appreciation continues to slow in 2014 with some markets seeing depreciation. Despite slowing appreciation, this summer selling season will be another strong season. With more inventory, we expect home sales to continue rising and the housing market will continue its path to a full recovery. There are certain headwinds that still face us. Affordability will become an issue in some markets this year, and in fact, already is an issue in several markets, particularly on the West Coast. As inventory levels continue to climb, appreciation rates will continue to ease – helping affordability, even though demand should continue to rise. Another risk factor is the slowing reduction in negative equity brought on by slowing appreciation rates. Currently, negative equity is still relatively high in many metros across the U.S. – nationally, 19.4 percent of mortgaged homeowners are underwater. Our forecast calls for another 3 percent appreciation from February 2014 to February 2015, which is more in line with historical appreciation rates. Still, 88 out of the 298 markets covered are forecasted to experience home value appreciation of 3 percent or higher over the next 12 months, showing that pockets of locally high appreciation will persist for a while.
To download data, please visit our data page.
