Leap Years: How the Housing Market Soared During the Pandemic (February 2022 Market Report)
Inventory is down by almost half from two years ago, helping push housing costs up throughout the transformative, two-year pandemic era.

Inventory is down by almost half from two years ago, helping push housing costs up throughout the transformative, two-year pandemic era.
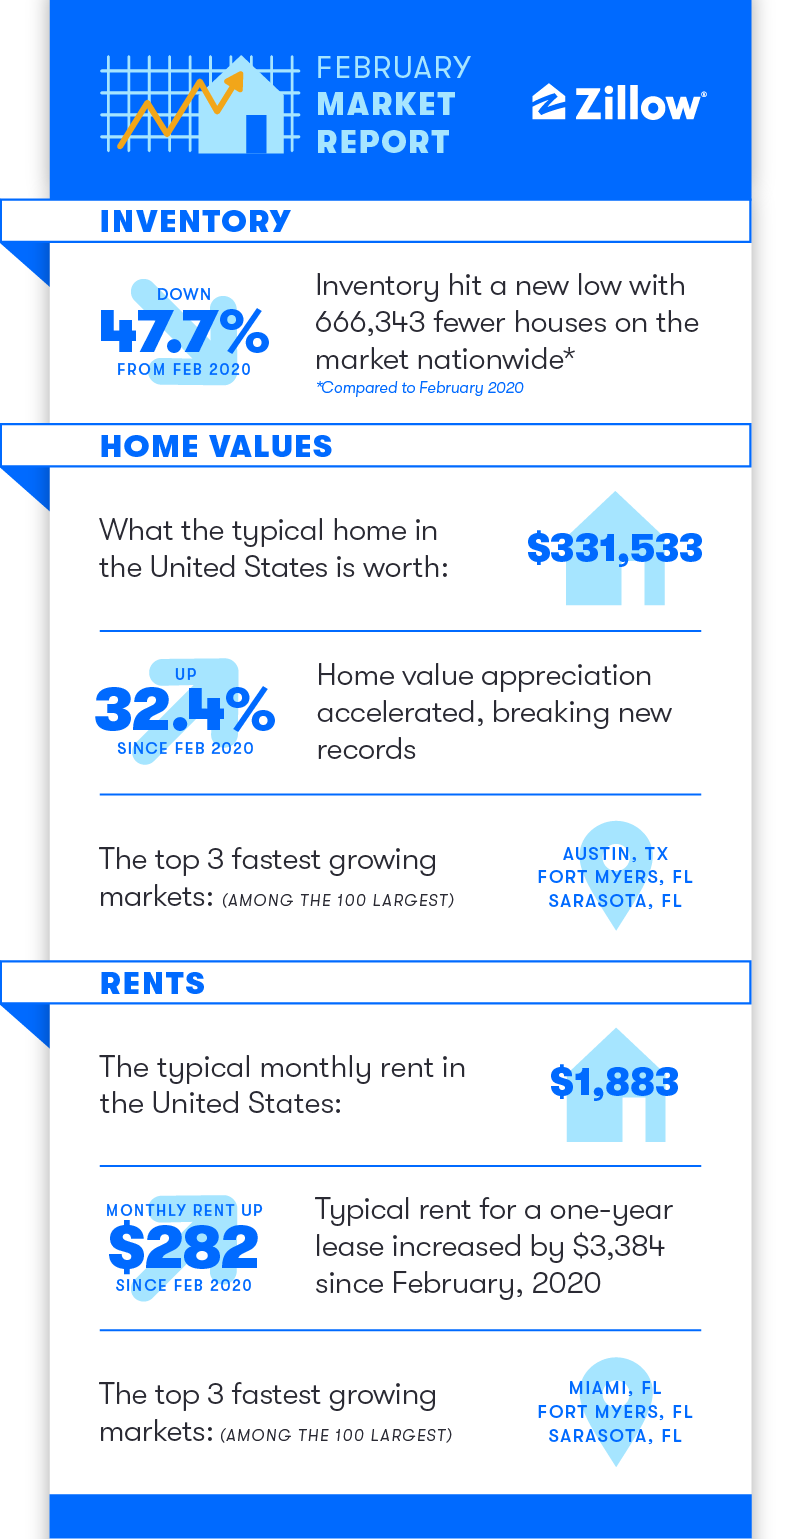
The number of homes for sale in February was down by almost half from the immediate pre-pandemic period two years ago, helping push housing costs up across the board throughout the transformative, two-year pandemic era. Rents are up by hundreds of dollars per month and home values up by almost a third over the same span, according to the February 2022 Zillow Monthly Market Report.
But still, despite the rapidly rising costs, demand from home buyers remains robust, with listings flying off the market and sales stronger than pre-pandemic levels.
The key metric driving these historic hikes is inventory. There were roughly 730,000 homes for sale nationwide in February, compared to 1.4 million in February 2020. Historically, inventory has generally bottomed out in December and then rebounded as sellers listed their homes in preparation for the busy spring shopping season. But this year, supply has continued to dwindle well into the new year and inventory was 11.9% lower in February than in January.
Of the 50 largest U.S. metros, those with the largest inventory deficit since 2020 are Raleigh (-69.7%), Hartford (-63%), Providence (-61.8%) and Miami (-61%). Those seeing the smallest decrease are San Francisco (-7.8%), San Jose (-17.9%) and Austin (-26.9%).
But enduring and extremely strong demand from home buyers meant that those homes that were listed got scooped up in just 11 days in February, six days faster than February 2021 and a full 25 days faster than in February 2020.
And despite the challenging shopping environment, sales are still brisk for this time of year. More homes transacted last month than in either February 2019 or 2020, though sales were 11% lower than in 2021. Sales generally slow through March before taking off in April, likely what we’re seeing now.
Economics 101 says the net effect of limited supply and robust demand is rapidly rising prices. The typical U.S. home is now worth $331,533 – up 32.4%, or $81,000, from February 2020. Home values rose 20.3% in just the past year alone, another new record for annual appreciation. In February 2020, annual home value growth was 3.7%, a figure much more in line with longer-term historic norms. And the rate at which home values are rising has also accelerated, with month-over-month appreciation hitting 1.6% in February, up from a recent low of 1.2% in November.
All 50 of the nation’s largest metro markets experienced double-digit year-over-year growth in February. Annual growth was fastest in Austin (45.4%), Raleigh (33.1%) and Tampa (31.%); annual growth was slowest in Baltimore (11.5%), Washington, D.C. (11.6%) and Milwaukee (11.7%). On a monthly basis, among the same 50 markets, growth was fastest in Salt Lake City, Raleigh and Nashville (all at 2.6%); monthly growth was slowest in New York (0.8%), Philadelphia (0.8%) and Chicago (0.9%).
The for-sale market is the most obvious place to look to see the effects of limited supply, but the rental market is not immune, either. Those buyers, especially aging millennials, searching for a home to buy but not finding one that meets their needs, budget and/or location preference – or losing out on that home to higher/faster bidders – means they are likely to stay renters longer. There are also likely many current renters that would prefer to own, but are not yet ready or are unable to enter the market because of financial or other considerations. At the same time, the large Gen Z generation is beginning to strike out on their own and enter the rental market as well. Combined, this high rental demand is keeping rental vacancy rates near all-time lows and pushing rent prices – after a brief, early pandemic pause – up at an almost equally fast pace as home values.
Rents in February reversed January’s brief cooling trend, shooting up 1.1% from last month and 17% from last year. Typical rent across the U.S. is now $1,883 per month, $283 per month higher than in February 2020. Rent growth was slow in 2020 after the outbreak of the pandemic but skyrocketed in 2021. The largest monthly rent hikes among major metros were in Buffalo (2.3%), New Orleans (2.2%), and Miami (1.9%). Only Las Vegas and Birmingham saw monthly declines, at 0.3% and 0.2%, respectively.
The pandemic brought with it extreme demand for homes that has pushed prices to rise at previously unimaginable rates. Extreme demand driven by historically low interest rates and a wave of Millennial and Baby Boomer buyers depleted a housing stock that was never really replenished by new construction after the glut following the Great Recession. It’s going to take some time for inventory to rise enough to help curb runaway price growth, even as builders are working feverishly to get new construction on the market. Rapidly rising mortgage rates that may make a new mortgage considerably more expensive than their current payment may also discourage some homeowners from selling. But the large sums of equity existing homeowners are sitting on after years of rapid home value growth might help tip the scales in favor of adding new inventory to the market as long-time homeowners consider cashing in as this spring home shopping season kicks off.
Annual home value growth is likely to continue accelerating through the spring, peaking at 22% in May, before gradually slowing through February 2023. More than 6.4 million total existing homes are expected to sell in 2022.
Monthly home value growth is also expected to continue accelerating in coming months, rising to 1.8% in March and 2% in both April and May before slowing somewhat. By the end of February 2023, the typical U.S. home is expected to be worth almost $400,000. The robust long-term outlook is driven by our expectations for tight market conditions to persist, with demand for housing exceeding the supply of available homes.
The seasonally adjusted annual rate of existing home sales in February is expected to total 6.36 million, down from 6.5 million in January 2022 but up from 6.17 million in February 2021 (February 2022 existing home sales data are scheduled to be released by the National Association of Realtors on March 18, 2022). Existing sales volume (SAAR) is expected to remain the same in March as in February, before climbing slightly to around 6.4 million, where it is forecast to remain through the remainder of the year. Overall, Zillow expects 6.416 million existing homes to sell in 2022, up 4.8% from an already strong 2021.
However, downside risks to our forecast remain. Continued elevated inflation heightens the risk of further monetary policy tightening, which would result in higher mortgage interest rates and weigh on housing demand.
