Uncategorized
Key Takeaways from the February New Home Sales Report
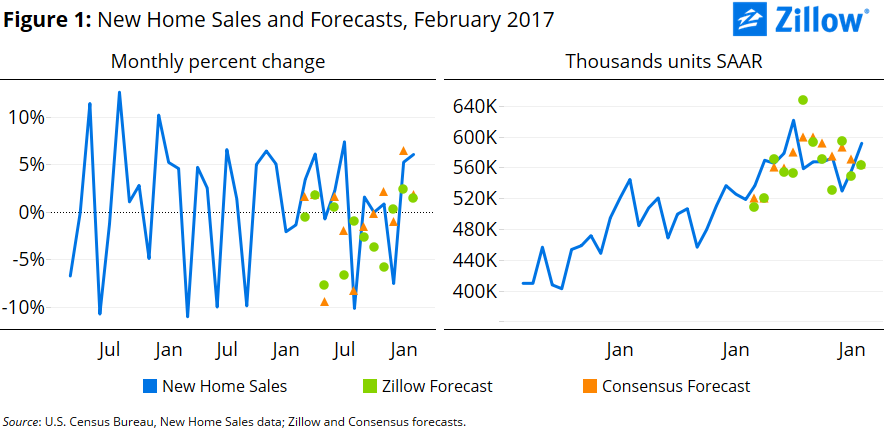
New home sales beat expectations, rising 6.1 percent in February to 592,000 units at a seasonally adjusted annual rate, according to the U.S. Census Bureau. It was the strongest month for new home sales since July 2016, and that month aside, the strongest month for new home sales since February 2008.
- New home sales increased 6.1 percent in February from January, to 592,000 units (SAAR), according to the Census Bureau.
- The number of new homes on the market edged up 1.5 percent from January to 266,000 units (SAAR), its highest level since July 2009 but less than half its pre-crisis peak.
- The median seasonally adjusted price of new homes sold in February fell 6.2 percent from January to $294,700, it’s lowest level in 20 months.
New home sales beat expectations, rising 6.1 percent in February to 592,000 units at a seasonally adjusted annual rate (SAAR), according to the U.S. Census Bureau (figure 1). It was the strongest month for new home sales since July 2016, and that month aside, the strongest month for new home sales since February 2008. Over the year, new homes sales were up 12.8 percent. New home sales for January were also revised upward by 3,000 units to 558,000 units SAAR, while sales for November and December were revised downward by a combined 7,000 units.
Regionally, new home sales were up 7.6 percent from January in the West and up 3.6 percent in the South – the two most important regions for new home construction. Over the year, new home sales were up 6.8 percent in the West and 7.9 percent in the South. But there appear to be diverging trends in these two regions. In the West, new home sales are at their highest level since January 2008 (with the exception of November 2016, when they were slightly higher than in February 2017). In the South, new home sales remain below where they stood for much of 2016: February 2017 sales were less than at any point between April and October 2016.
The number of new homes on the market increased 1.5 percent from January to 266,000 units (SAAR), its highest level since July 2009. On-market inventory of new homes is now up 9.9 percent from last February. However, it remains low by historic standards: The number of new homes on the market remains lower than it has been since January 1993. Existing home sales data reported yesterday showed that there was essentially no change in the number of existing single-family homes on the market in February, so all of the growth in the number of single-family homes on the market last month came from new construction.
The median seasonally adjusted price of new homes sold in February fell 6.2 percent from January to $294,700, down 4.65 percent over the year. It was the lowest median seasonally adjusted sale price since June 2015 — and the first time it has fallen below the $300,000 mark since May 2016.
Price growth among new homes sold stabilized during the second half of 2016: Between January and June of 2016, the median seasonally adjusted price of new homes sold increased 8.8 percent from $296,400 to $322,300, but from June to December the median sales price fell 1.1 percent.
For more on February new home sales data, see the commentary from Zillow Chief Economist Dr. Svenja Gudell.

