In a recent post we lifted the lid on free and clear homeowners, revealing who and where they are and offering graphical explanations for the difference in free-and-clear rates across the country. We concluded those differences were due to the variation in home values and the characteristics of those taking out primary mortgages, namely credit scores and ages. As this Zillow report circulated, we kept getting the same question: Has the percentage of homeowners who are free-and-clear changed over time?
To answer this question, we turned to the historical data in the U.S. Census. Indeed, time has delivered its fair share of influence. In 1940, 55% of non-farm homeowners owned their homes outright. By 1980, this share dropped to 35%. Seemingly leveling out into the following decades (but not without fluctuations), Census data shows 33% of homeowners free and clear in 2010, and Zillow’s Negative Equity 2012 Q3 data shows 29% of homeowners are free-and-clear on their homes.
Various government programs such as the Federal Housing Administration (FHA) insurance program and the creation of Fannie Mae in the 1930s were intended to encouraging homeownership and combat the Great Depression by providing jobs in new housing construction. These policies opened the possibility of homeownership to a larger portion of the population. States’ legal limits on the loan-to-value ratio of mortgages, some as low as 40%, were relaxed or removed entirely. Federal insurance on mortgages allowed banks to loan to more “risky” households, and the average length of fully amortizing mortgages increased. In 1944, the VA home loan program was originally conceived extending mortgage credit to the men returning from World War II. The dramatic reduction in the percentage of homeowners free and clear on their mortgages during the pre-1980 decades coincided with a dramatic increase in the homeownership rate. In 1940, only 44% of homes were owner-occupied. Only those who could afford to pay in cash or pay off their debt quickly owned homes, leaving most free and clear. By 1980, with home financing more readily available because of government programs, a larger portion of homes were owner-occupied (64%) precisely because holding more mortgage debt was possible.
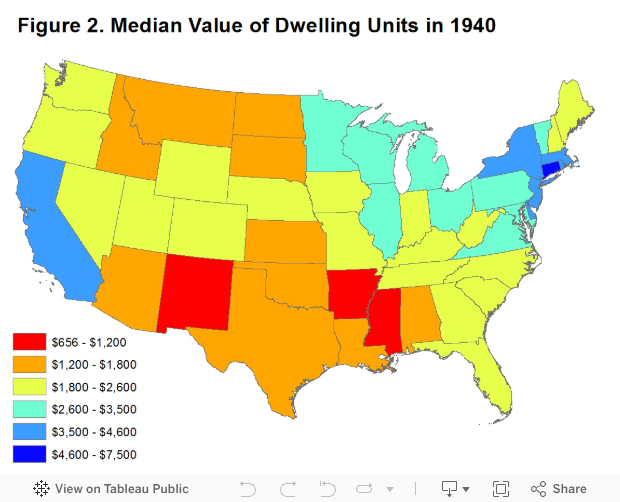
As Figure 1 below shows, this pattern holds within most U.S. states as well. However some Northeast states never enjoyed high rates of free-and-clear homeowners in 1940, particularly Connecticut, New York, Massachusetts and Rhode Island. These states also were among those with the lowest homeownership rates that decade. These states are likely set apart due to their relatively high home values in the 1940s and 1950s (see figure 2). Not many people could afford to buy homes in these locations outright.
After 1980, the free-and-clear rate pattern still mirrors the homeownership rate. As the percentage of owner-occupied homes increases, the percentage of homeowners who are free-and-clear decreases. The driving force behind these more recent patterns, however, is reasonably a story of home prices. In earlier decades, conventional economic wisdom linked housing prices directly to construction costs, pure and simple. But in recent decades, as epitomized by the housing bubble, home values have also been driven by speculation as housing took root as a consumption and investment good. As the bubble built in the 1990s and early 2000s, subprime mortgages were born, and homeownership rates increased as the free-and-clear rate decreased. Households and investors fueled the bubble by flocking to this “safe” asset.
We all know what happened next. The bubble burst, prices fell hard and many mortgage market lenders failed. Cheaper homes, stricter loan standards and a flood of foreclosures across the country left free-and-clear homeowners to take up a larger portion in 2010 than in 2000. Holding true to the pattern, the rate of homeownership dropped 1% from 2000 to 2010 as the percentage free and clear increased.
In general, fluctuations in the percentage of homeowners who are free-and-clear on their mortgages are driven by access to mortgage credit throughout the population and the affordability of housing. The drivers behind these metrics are part of an evolving story from new government programs in the 1930s and 1940s to unsustainable speculation in the early 2000s.