FSBOs May Fit the Bill For Buyers Looking for Affordable Options
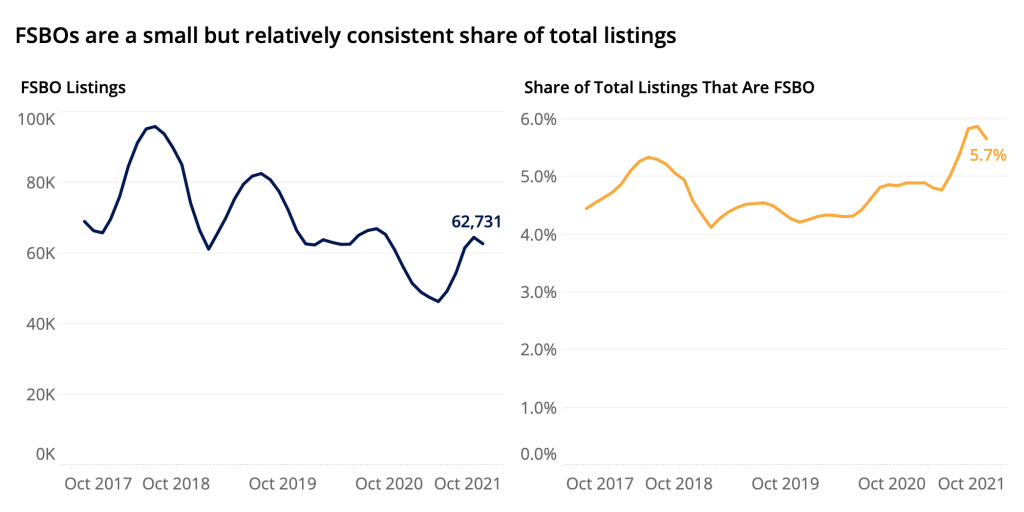
For sale by owner (FSBO) listings are a small but relatively consistent share of total U.S. home listings -- since 2018, FSBOs have accounted for around 4-6% of total monthly listings.
For sale by owner (FSBO) listings are a small but relatively consistent share of total U.S. home listings -- since 2018, FSBOs have accounted for around 4-6% of total monthly listings.
Relative to more-common for sale by agent (FSBA) listings, for sale by owner (FSBO) listings are both more likely to be utilized by lower-income sellers and for marketing less-expensive homes. This is likely in large part because nationwide, FSBO homes themselves are more likely to be both smaller (and so generally less pricey) and located in rural areas, where homes also tend to be less expensive and incomes lower.
Still, for budget-conscious buyers willing to accept these potential tradeoffs in favor of finding a suitable home in this ultra-competitive market, FSBO listings may fit the bill.
FSBOs are a small but relatively consistent share of total listings — since 2018, FSBOs have accounted for around 4-6% of total monthly listings. In September 2021, roughly 63,000 U.S. home listings were FSBO, compared to 1.05 million agent listings.
FSBO sellers earn lower incomes than sellers overall, according to the 2021 Zillow Consumer Housing Trends Report. Compared with higher-income sellers, sellers with annual household incomes less than $50,000 were the least likely to use an agent. Over the last three years, 24% of sellers making less than $50,000 did not use an agent, compared to just 16% of sellers making between $50,000 and $100,000 per year and 13% of sellers with more than $100,000 in annual household income.
Share of Sellers That Said They Did NOT Use an Agent to Help Sell or Promote the Sale of Their Home
| Household Income | 2019 | 2020 | 2021 | 3-Year Average |
| < $50k HH Income | 23% | 25% | 25% | 24% |
| $50k – <$100k HH Income | 17% | 17% | 16% | 16% |
| $100k+ HH Income | 12% | 12% | 14% | 13% |
This income skew translates to lower-priced homes. Even across all sellers, households with lower incomes tend to list at lower prices. The typical lower-income seller reported selling their home for 41% less than the highest-income sellers, according to our surveys. Over the past three years, the average selling price for households earning less than $50,000 was about $160,000, compared to more than $264,000 for those earning six figures.
Median Sale Price by Household Income of Seller
| Household Income | 2019 | 2020 | 2021 | 3-Year Average |
| < $50k HH Income | $156,672 | $165,000 | $160,000 | $160,557 |
| $50k – <$100k HH Income | $225,000 | $228,276 | $245,600 | $232,959 |
| $100k+ HH Income | $255,273 | $266,899 | $270,000 | $264,057 |
At the median, this means that FSBOs are also listed at lower prices. Across all listings nationwide in September 2021, FSBOs were listed for 17.7% less than FSBAs. Locally, FSBOs are listed at lower prices than FSBAs in 36 of 50 states and in 23 of the largest 50 MSAs.
The price differential between FSBOs and FSBAs is explained in large part by the fact that FSBOs are more common in rural areas and amongst smaller home types. Areas with the largest FSBO price savings likely reflect the greater skew toward rural and smaller home types of FSBO listings in those areas. Our survey found that in 2021, 24% of rural sellers did not use an agent, compared to 16% of suburban and 20% of urban sellers. At the same time, 30% of sellers of “other” home types (which include oftentimes smaller townhouses, rowhouses, duplexes, triplexes, mobile homes and manufactured homes) did not use an agent, compared to 18% of condo/co-op/apartment sellers and 15% of single family sellers. So, FSBOs generally are not cheaper because the home is listed at a discount — rather, FSBOs are cheaper because they are more likely to be in inexpensive rural and/or remote areas and are generally smaller home types.
Share of Sellers That Said They Did Not Use an Agent to Help Sell or Promote the Sale of Their Home by Urbanicity
| Urbanicity | 2019 | 2020 | 2021 | 3-Year Average |
| Urban | 19% | 21% | 20% | 20% |
| Suburban | 14% | 15% | 16% | 15% |
| Rural | 23% | 15% | 24% | 21% |
Share of Sellers That Said They Did Not Use an Agent to Help Sell or Promote the Sale of Their Home by Type of Home
| Type of Home | 2019 | 2020 | 2021 | 3-Year Average |
| Single-family detached house | 15% | 15% | 15% | 15% |
| Condo / Co-op / Apartment | 16% | 15% | 18% | 16% |
| Other Type of Home (Townhouse/Rowhouse/ Duplex/Triplex/Mobile/Manufactured/Other) |
31% | 28% | 30% | 30% |
Zillow listings data shows a similar rural skew. Based on year to date listings (Jan 2021-Sep 2021), FSBO listings are more common in rural areas (7% of all rural listings) than suburban (5%) or urban (4%). Put another way, 30% of FSBO listings are in rural areas, compared to just 21% of FSBA listings.
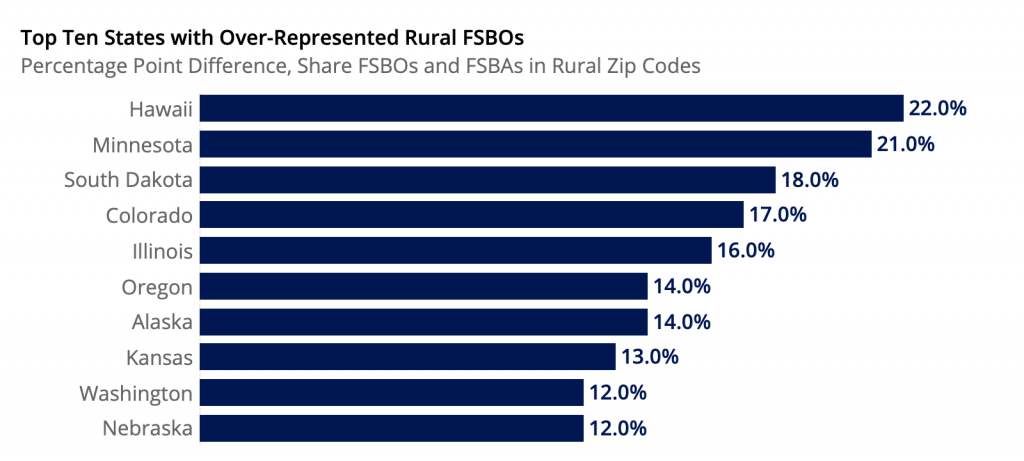
In all but two states (Vermont and Connecticut), FSBO listings are overrepresented in rural areas – calculated as the share of FSBO listings in rural areas, minus the share of FSBA listings in rural areas. These are the ten states where rural FSBOs are most overrepresented, compared to FSBAs (i.e. In Hawaii, the share of FSBOs in rural ZIP codes is 22 percentage points higher than the share of FSBAs in rural ZIPs) :
Finally — likely due to structural inequities in income and, in turn, home value and home type — sellers of color, particularly Black and Latinx sellers, are slightly less likely to report using an agent. On average over the past three years, 83% of white sellers reported using an agent to help sell their home, compared to 79% of Black sellers and 76% of Latinx sellers.
Share of Sellers That Said They Used an Agent to Help Sell or Promote the Sale of Their Home by Race
| 3-Year Average (2019-2021) | |
| Total Sellers | 83% |
| White or Caucasian | 83% |
| Black or African American | 79% |
| Latinx or Hispanic | 76% |
| AAPI | 82% |
