Uneven Recovery: Many High-Foreclosure ZIP Codes Haven’t Bounced Back
In most major markets, ZIP codes that experienced the fewest foreclosures during the housing bust have recovered significantly more than those with the most foreclosures – a phenomenon that further exacerbates wealth inequality.
- In most major markets, ZIP codes that experienced the fewest foreclosures during the housing bust have recovered significantly more than those with the most foreclosures.
- The gap in recovery rates between high-foreclosure and low-foreclosure ZIP codes is especially pronounced throughout California and in many Midwest metros.
- The median U.S. home is worth 9.8 percent more today than its pre-recession peak value.
An average person would likely conclude that the U.S. housing market has recovered from the crash that began just over a decade ago. And in many ways, they’d be right: The nation’s median home is now worth 9.8 percent more than it was at its peak prior to the housing bust, and half of all U.S. homes are worth at least as much as they were at the peak of the housing bubble.
However, across many of the country’s largest markets, the recovery has been far from universal. Home values in more than a third of major markets still lag levels from a decade ago. But that doesn’t tell the entire story.
In an effort to paint a more granular picture of the recovery, Zillow compared recovery rates of homes – what share of homes have recovered their pre-recession peaks – in the nation’s largest metro areas, grouping them into three tiers defined by ZIP-level, bust-era foreclosure rates. [1] The analysis found that in 19 of the 35 largest markets, the recovery rates of homes in ZIPs that experienced low levels of foreclosures is significantly higher than those in high-foreclosure ZIPs – that is, there’s a double-digit percentage point gap between their recovery rates. This suggests that, throughout much of the country, there remains inequity: Areas that were hardest hit by the crisis continue to bear an outsized burden even as much of the nation recovers.
This list of 19 metros with a disparity in recovery rates reaches beyond markets where the typical home still has not reached its pre-recession peak. In fact, based on median home values, 12 of these 19 would be viewed as having recovered their recession-driven losses – for example, in Atlanta, Ga., the median home is now worth 13.6 percent more than its largest pre-recession value. However, only 39.4 percent of homes in Atlanta’s high-foreclosure ZIP codes have recovered their pre-recession peak values, compared to 77.6 percent of homes in low foreclosure ZIPs – a 38.1 percentage point difference.
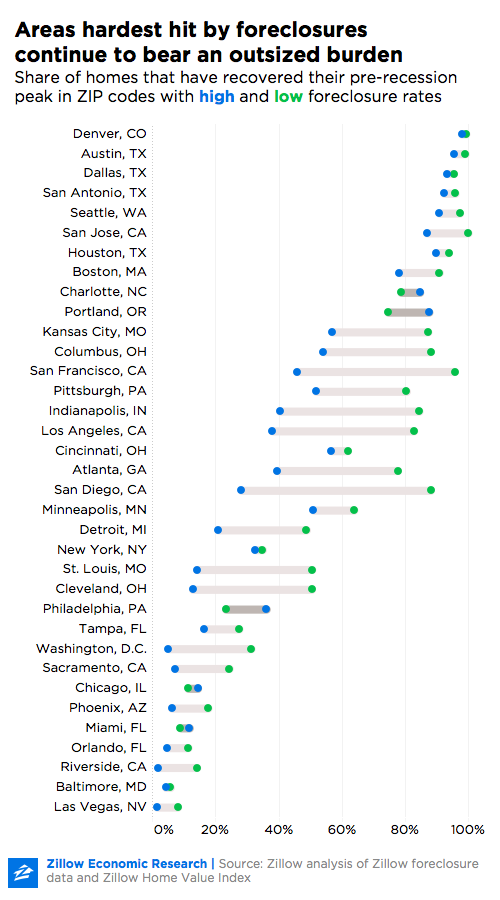
A similar trend has happened in the six largest metro areas in California. While median homes in Riverside and Sacramento remain below their pre-recession peak values, Los Angeles, San Diego, San Francisco and San Jose are commonly referred to as bull markets for homeowners. In fact, the median home in San Jose is worth 73.3 percent more today, at $1.3 million, than it was at its pre-recession peak of $743,800 in March 2007. However, while all homes in low-foreclosure ZIP codes have recovered their pre-recession peak values, only 86.8 percent of homes in high-foreclosure ZIPs have, meaning 3.3 percent of homes in San Jose are still struggling to bounce back.
The difference is even more stark in San Francisco, where the median home is worth 36.4 percent more than its pre-recession peak. Less than half, 45.7 percent, of homes in ZIP codes with high recession-era foreclosure rates have recovered their pre-recession peak value, compared to 95.6 percent of homes in low-foreclosure ZIPs – a 49.9 percentage point difference. San Diego has an even larger gap between these two classes, 59.8 percentage points – the largest of any major metro in the nation. Just 28.2 percent of homes in high-foreclosure San Diego ZIPs have recovered their pre-recession highs.
The list also includes a high concentration of Midwestern metro areas. Detroit and Cleveland, two markets still striving to recover their pre-recession peak median home values, have a greater than 25 percentage point difference in recovery rates between ZIP classes. The same is true of Pittsburgh; Columbus, Ohio; and Indianapolis, three markets where the median home value greatly exceeds its pre-recession peak.
Intriguingly, several “fast-growing” metros have seen substantial home growth across all foreclosure tiers. In both Seattle and Denver, more than 90 percent of homes in high-foreclosure ZIPs have recovered their pre-recession high values, as have those in low-foreclosure ZIPs. Four major markets in Texas – Dallas, Houston, San Antonio and Austin – also have seen strong recoveries in both ZIP classes, including a recovery of the vast majority of homes in high-foreclosure ZIPs in each market.
In five cases, the opposite is true: high-foreclosure ZIPs have fared better than neighboring ZIPs with low-foreclosure rates. In Portland, Ore., where the median home is worth a third more than it was pre-crash, the recovery rate of homes in high-foreclosure ZIPs is 12.9 percentage points higher than that of homes in low-foreclosure ZIPs. In Philadelphia, where the median home is valued 3.4 percent less than it was at its pre-recession peak, there’s a 12.8 percentage point gap in favor of high-foreclosure ZIPS.
While the typical home is now more valuable than ever in 21 of the top 35 metro areas, a significant portion of homeowners still struggle to recover what was lost in the Great Recession. The uneven recovery, especially in markets that have prospered at the median, further exacerbates wealth inequality, as people who kept their homes through the crash and recovery watch home values in nearby ZIP codes – and the opportunity to build wealth through homeownership – pass them by.
[1] Groups were assigned by selecting a ZIP code’s maximum monthly foreclosure rate between 2007 and 2009, then sorting into three tiers. The analysis compares the high-foreclosure tiers and low-foreclosure tiers for each metro.
