- Though the economic climate can always shift – sometimes suddenly – a national recession is not imminent on the near horizon.
- There is no nationwide housing bubble, or subsequent bust, to be overly concerned with, though some regional housing markets and some market sub-segments are clearly exposed to more risk than others.
- It is wise to be cautious, but there is clearly home buying demand that is currently going unmet, particularly at affordable price points.
Economists are fond of saying that economic expansions “don’t die of old age.” But the current expansion’s longevity – it is now the third-longest economic expansion in American history[1] – naturally prompts questions, and fears, about its eventual end.
The housing market played a central role in the past decade’s national economic drama, so the housing industry is particularly sensitive to these concerns.
But the housing market today is very different from the housing market during the bubble years. If the mid-2000s housing market was characterized by a surge in demand driven by newly qualified mortgage borrowers, the mid-2010s housing market has been characterized by a dearth of supply. For-sale inventory of homes on the market is touching historic lows. The number of homes hitting the market has been steady, but those homes that do list are selling very quickly, leaving fewer homes on the market at any given time – a clear signal of demand outpacing supply.
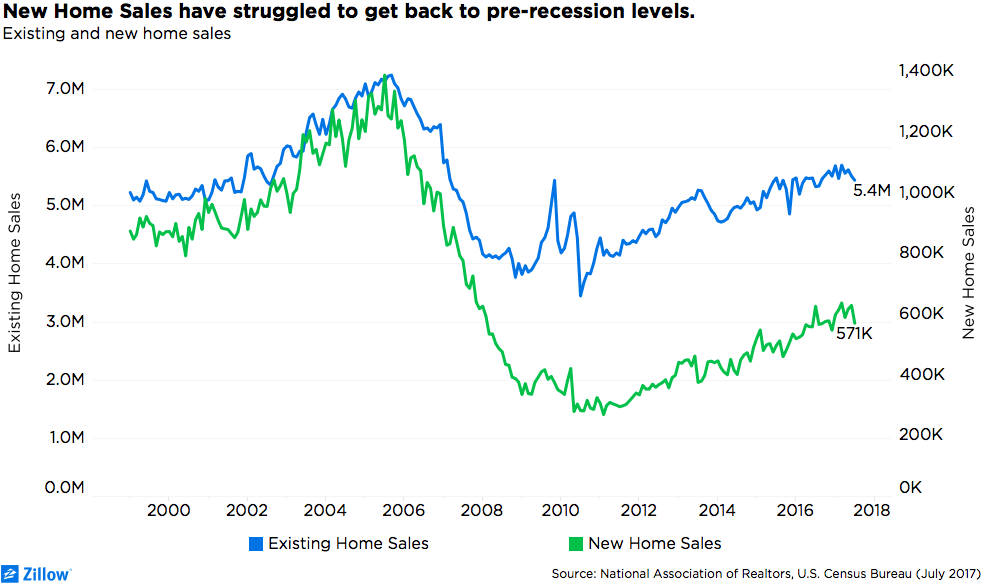
Despite evidence of strong demand, new home building has been much slower to recover than the overall housing market. While the number of existing single-family homes sold is currently only 2 percent below its early 2000s average (roughly 105,000 fewer existing homes sold over the year), new home sales are 41 percent (or 393,000 units) below their early-2000s average. New home completions are 37 percent (487,000 units) below their early-2000s average.[2]
No one wants to repeat the mistakes of a decade ago. But recent history can also cloud our judgement of the future. We took stock of several common fears about the American housing market – fears that could be weighing on new construction – including:
- Fears that the next recession is imminent
- Fears that borrowers are overextended
- Fears that housing markets are overvalued
There is no recession likely on the near horizon. Further out is more difficult to predict – more dramatic shifts are more likely on a longer horizon – but the housing market is unlikely to play a central role in the next nationwide economic downturn. Mortgage lending standards have leaned conservative in the post-crisis era, constrained by regulations, and it is unlikely that borrowers who succeed in obtaining a mortgage are overextending their personal finances. Nationwide, the housing market is perhaps slightly undervalued, or on par with historic norms after controlling for exceptionally low interest rates, though there are regional pockets where overvaluation is more likely.
The Next Recession: Not Imminent, Not Housing-Focused
 It is a fool’s errand to predict the precise timing of the next recession, and economists have a notoriously poor record of forecasting downturns. But the profession has done somewhat better at pointing to likely areas of accumulating risks.
With these cautions in mind, Zillow recently polled more than 100 leading economists about the likely timing and triggers of the next U.S. recession. The panel put the near-term risks very low, finding a very slim 5 percent probability that the next recession will start in the remainder of 2017 and just a 23 percent probability that the next recession will start before the end of 2018 (at the median). Three-quarters of respondents put the odds of the next recession starting before the end of 2018 as less than one-in-three.
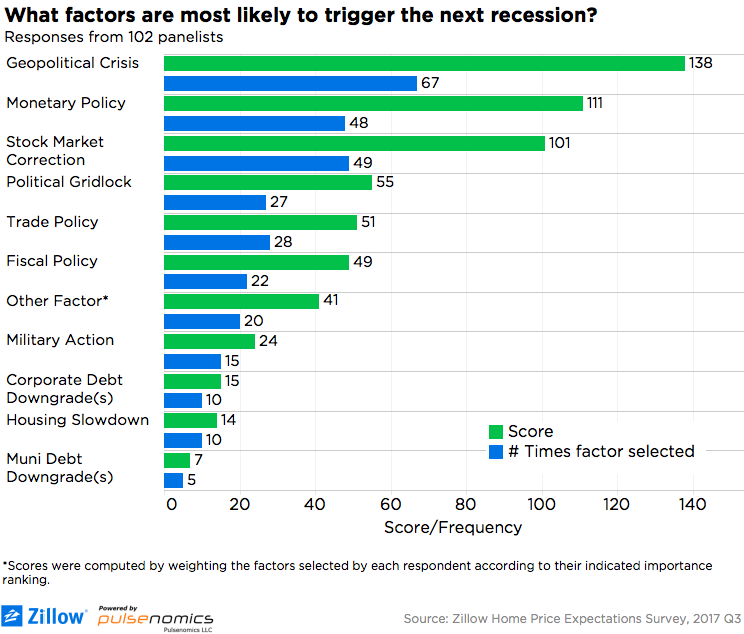
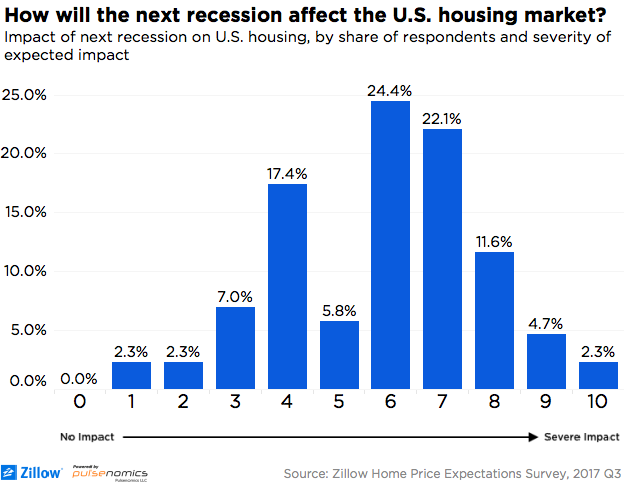 Most economists also said they believed the next recession is both unlikely to be triggered by, and will have only a moderate impact on, the housing market overall (very much unlike last decade). When asked about likely causes of the next recession, the housing market ranked behind potential geopolitical crises, monetary policy, a stock market correction, political gridlock, trade policy, fiscal policy, military action and a corporate debt downgrade. When asked to rank the next recession’s impact on housing on a zero-to-10 scale – with zero representing “no impact,” five a “moderate impact” and 10 a “severe impact” – respondents selected an impact of 6, on average; a third (34 percent) of respondents scored the effect less than 5.
So the national economic picture looks relatively clear for housing, at least for now – though conditions can change quickly. And it’s important to note this current outlook does not preclude the possibility that economic activity could slow more dramatically in some parts of the country. Regional economic downturns are relatively common in recent history, though they typically do not spill over into broader national economic weakness.
Are Borrowers Overextended? Generally, No
Mortgage lending standards represent perhaps the sharpest difference between the current housing market and market conditions that prevailed in the mid-2000s. During the housing boom years, an expanded pool of borrowers (including some with shaky personal finances) were able to access increasing amounts of leverage as they stretched their budgets to buy homes. Rising home prices, buoyed by demand, pushed each subsequent wave of borrowers to stretch further – until the downturn hit.
In the aftermath of the crisis, legislation substantially restricted the types of loans eligible for a federal guarantee (via the two government-sponsored enterprises) that helps mitigate some lending risk. Lenders can still originate riskier loans, but they must carry the risk on portfolio or sell these loans to private investors without a government guarantee. And while there have been some efforts to expand high loan-to-value lending in recent years, making it easier to buy with smaller down payments, credit score restrictions have held relatively firm. Overall, mortgage lending standards today probably lean slightly conservative. Borrowers buying with higher degrees of leverage today generally have solid personal finances.
One difficult result of post-recession financial regulations has been that, unlike during the mid-2000s, buyers confronted with deteriorating affordability in booming markets cannot simply resort to borrowing more. Without easy access to financing, there is no easy way to avoid structural housing market challenges.
As affordability has deteriorated in some markets, there is growing political pressure on regulators and financial pressure on mortgage lenders to expand both the pool of eligible borrowers and the amount they can borrow. While the current regulatory environment has its flaws, there is little doubt that post-crisis regulations have played a critical role in ensuring that home buyers today have relatively sound personal finances, and that mortgage lending does not currently pose a broader housing market risk. But the situation is evolving and merits regular monitoring.
Are Markets Overvalued? Depends on Location…
There are a number of moving parts to consider when assessing whether a housing market is overvalued – notably mortgage interest rates, incomes and employment trends. Lower interest rates correspond to higher valuations as home buyers are able to borrow more. Local increases in incomes or employment density can also prompt an increase in local real estate values.
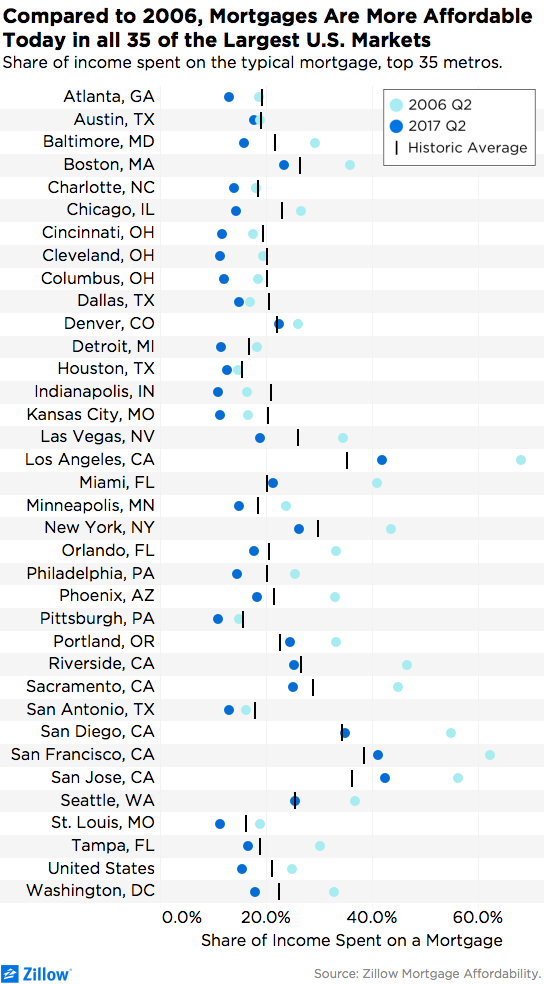
Nationwide, the share of household income (15.5 percent) needed to afford the typical mortgage payment is below both where it stood at the peak of the mid-2000s boom years (24.9 percent in Q2 2006) and its historic average (21 percent). This is, in part, driven by interest rates which remain near historic lows – a rarity for periods when the labor market is at full employment. If mortgage rates were at 6 percent rather than 4 percent – still at the lower end of where they’ve historically been during similar economic periods – the share of income spent on a mortgage would be 21 percent, still below 2006 levels and in line with longer-term historic averages.[3]
These data suggest the national housing market is slightly undervalued because of prevailing interest rates – and, after controlling for currently low interest rates, is roughly in line with historic norms.
Of course, this conclusion varies widely across different markets.
Looking at the 35 largest housing markets, the share of income spent on the typical mortgage is below 2006 levels in all 35 markets, and below historic levels in all but seven markets: San Jose, San Francisco, Portland, Miami, San Diego, Denver and Seattle. Controlling for atypically low interest rates, the share of income spent on the typical mortgage remains below 2006 levels in all but five markets – Denver, Dallas, Houston, San Antonio, and Charlotte – but above historic levels in 19 markets, with the largest deviations in Los Angeles, San Jose, San Francisco, San Diego, Portland, Seattle, Denver, Miami, Riverside and New York.
No single metric can capture the full complexity of valuation risks. Normalizing interest rates matter more the longer the expected holding period. For a buyer who expects to own a home for a short period of time – for example, the time necessary to tear down an older structure and rebuild a new structure (or structures) – valuation risks associated with interest rates are less important, since interest rates are unlikely to move dramatically over short time periods.
For some of the markets that deviate from historic norms according to multiple metrics cited above – including Seattle, Denver and Dallas – there have arguably been structural shifts in local employment and industry dynamics. In markets with booming labor markets or a shift in local employment from industrial to service-sector jobs (which tend to be associated with higher incomes), it is plausible that demand has shifted such that the share of income necessary for a mortgage payment is now above historic norms.
…And Market Segment
Similar arguments could be made for market sub-segments. Over half (50.3 percent) of all homes for-sale as of July 2017 were in the upper third of the price distribution, a share that has been rising over the past two years; less than a quarter (23.8 percent) were in the bottom third of the price distribution. If demand and supply were similarly balanced across all price points, one-third of homes for sale would be in the top third of the price distribution and one-third of homes for sale would be in the bottom third. At higher price points, supply and demand are closer to being in balance – which implies greater risk for builders.
This is all to say that regional and sub-market valuation risks are real. Coastal California markets tend to be outliers on many of these metrics; the data on recent boomtowns including Seattle, Portland, Dallas and Denver are more mixed and merit monitoring. Supply is clearly outpacing demand at the highest price points nationwide. But valuation risks should also be interpreted with awareness of each particular buyer’s risk profile and holding period.
Final Thoughts
A key challenge for any professional is to learn from the past without being paralyzed by it. A decade after the fact, the housing market boom and bust and the recession that followed are still fresh in many minds.
But while there are some parallels, today’s housing market is different from the housing market of the mid-2000s:
- Though the economic climate can always shift – sometimes suddenly – a national recession is not imminent on the near horizon.
- There is no nationwide housing bubble, or subsequent bust, to be overly concerned with.
- Some regional housing markets and some market sub-segments are clearly exposed to more risk than others.
It is wise to be cautious, but there is clearly demand out there, particularly at affordable price points.
[1] Since records begin in the late 1850s. National Bureau of Economic Research, Business Cycle Dating Committee.
[2] Relative to the peak boom years, existing single-family sales are still down 24 percent and new home sales are down 57 percent.
[3] 30-year, fixed mortgage rate. Historic average corresponds to the period 1985 to 1999.

