Equity Inequality: The Differing Impact of the Boom and Bust on Millennial, Gen X and Older Homeowners
Typical millennial and Gen X homeowners with a mortgage have roughly similar levels of equity in their homes, even though Gen X homeowners are older and have had a longer window to own a home and build equity in it.
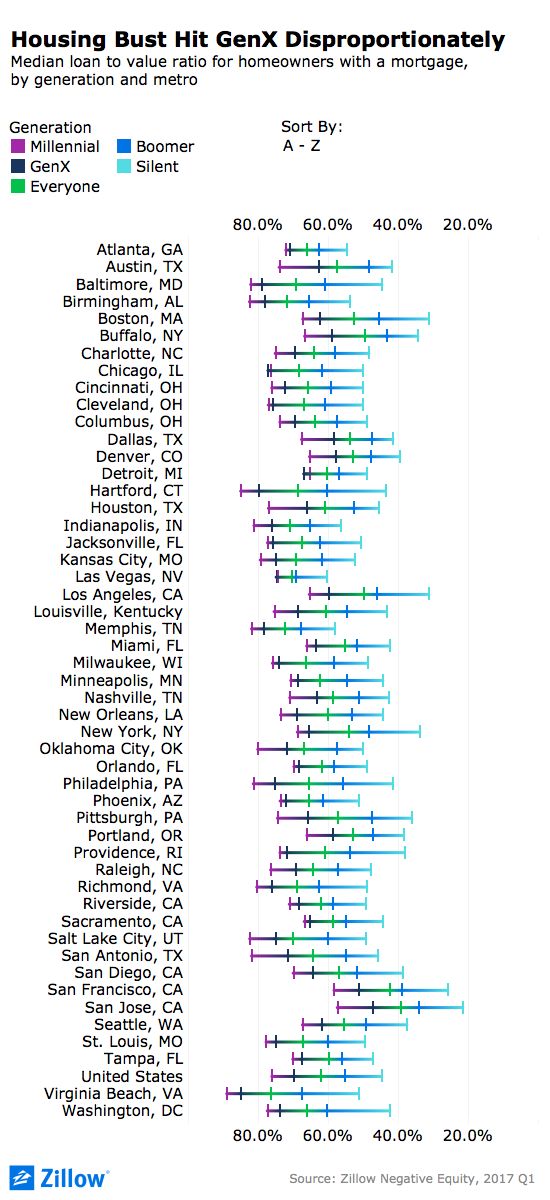
- The median-mortgaged homeowner still owes the bank 62 percent of their home’s value. Gen X homeowners with a mortgage owe a median of 70 percent of their home’s value.
- Only 1.3 percent of mortgaged Gen X homeowners are close to owning their homes outright.
- Millennials owe less of their homes’ value than Gen Xers do in Las Vegas, Chicago, and Detroit.
Homeowners from different generations have benefited unequally from the past half-decade of national home value growth. While this period of uninterrupted home value growth has enabled millennial homeowners to fairly rapidly accumulate equity in more recently purchased homes, their older siblings in Generation X are in many cases only recouping losses in equity incurred during the Great Recession.
As a result, typical millennial and Gen X homeowners with a mortgage have roughly similar levels of equity in their homes, even though Gen X homeowners are older and have had a longer window to own a home and build equity in it. And both generations’ equity accumulation lags far behind their parents and grandparents in the Baby Boomer and silent generations.
The lower a homeowner’s loan-to-value ratio (LTV), the closer they are to owning their home debt free. The median millennial homeowner with a mortgage has a LTV of 76.2 percent, compared to 70 percent for typical mortgaged Gen X homeowners, according to the Q1 2017 Zillow Equity Report. That means that if these homeowners each own a home valued at $100,000, the millennial homeowner would still owe about $76,000 on their mortgage, while the Gen X homeowner would owe $70,000. The median Baby Boomer homeowner with a mortgage has a LTV of almost 55.6 percent, and typical Silent Generation homeowners with a mortgage have a LTV of 44.9 percent. In other words, their homes are typically worth more than double what they owe on them. Among all homeowners with a mortgage, regardless of age, the median LTV is 62.2 percent.
Nationwide, the large majority of homeowners with a mortgage (roughly 89.6 percent) have at least some amount of equity in their homes, a critical means of building wealth for millions of U.S. families. But as of the end of Q1, 10.4 percent of homeowners with a mortgage, more than 5 million borrowers overall, were trapped in negative equity, or “underwater,” owing more on their home than it is worth.
Being in negative equity can lead to a greater risk of foreclosure and it can be incredibly difficult, if not impossible, to sell or refinance an underwater home. This, in turn, is likely contributing to persistent inventory constraints as underwater homeowners who might otherwise choose to list their homes for sale are blocked from doing so.
For more on negative equity, how it has evolved over time and where it remains the biggest problem, see our deeper dive here.
What’s Equity?
Equity grows as a home’s value increases over time, which is a primary reason people buy homes rather than rent – to use that home as an investment. Equity is roughly the amount a homeowner could sell their house for, minus what is owed on it. When homeowners accrue enough equity in their homes, they can tap into it for all sorts of purposes. Many homeowners use this equity to pay for improvements to their home, help fund their retirement, pay for a child’s education and/or as a down payment on another home if they opt to sell their current one.
As long as home values keep rising, homeowners will generally continue to build equity. And typically, the longer a person owns a home, the more equity they will build.
Click here for a more in-depth look at how equity and negative equity work.
So What?
When home values drop, so does the equity people have in their homes. And the timing of the last big market downturn meant that decline in home values affected homeowners of different ages to differing degrees.
The U.S. housing market began its decline roughly a decade ago in mid-2007, beginning a long period of falling home values that only began to turn positive again in earnest in early 2012. At the time of the market collapse, Gen X home buyers were just aging into their prime first-time home buying years – roughly their late twenties and early thirties – and it’s likely many members of this generation entered the market in the months and years immediately leading up to the housing crash.
From the pre-recession peak of the housing market in April 2007 through its bottom in December 2011, the median U.S. home lost 22.9 percent of its value. Over the past roughly half-decade, from the bottom of the market through May 2017, the typical U.S. home value grew by 31.4 percent. Today the typical U.S. home is finally worth more than it was prior to the recession, and home values in many individual markets exceeded their pre-recession peaks months or even years ago.
So, in a nutshell:
- Older Baby Boomers and Silent Generation homeowners likely owned homes long enough to build sufficient equity in the years leading up to the recession that they could withstand deep home value losses. And by riding those losses out, they were also able to gain more equity during the recovery that followed.
- Younger Gen X homeowners were unlucky, entering the market just as things started to sour. Because they hadn’t owned their homes very long, they didn’t have as much time to build equity before housing values plunged, and so were hit harder by the negative equity crisis that followed. Five years into the recovery, these homeowners are making equity progress, but have a ways to go and aren’t too far ahead of their younger brethren.
- Roughly two-thirds (64.2 percent) of millennial homeowners purchased their home in the past five years. Although many of them have faced strong competition entering the market, they were lucky enough to enter a largely positive market, potentially building a lot of equity in only a few years and never having to ride out a long tough stretch – putting them on near-equal footing with their older Gen X siblings.
Among Silent Gen homeowners with a mortgage, 11.8 percent have a LTV of 10 or less; 6.1 percent of Baby Boomer homeowners with a mortgage have a LTV of 10 or below. Just 1.3 percent of Gen X and 0.3 percent of millennial homeowners with a mortgage fall below that threshold.
A little more than one-third of U.S. homeowners (36.7 percent) have a LTV of 0, owning their home free-and-clear.
Local Differences
While overall U.S. median home values have surpassed their pre-recession peaks, many local markets – especially in the Southwest, Midwest and Southeast – were hit even harder than the nation as a whole, and home values remain a long way from their prior highs. Not coincidentally, the gap in equity between millennial and Gen X homeowners is smallest in these hard-hit areas:
- In and around Las Vegas, home values plummeted a whopping 62 percent between their May 2006 peak and December 2011 bottom. Today, millennial homeowners with a mortgage in Vegas actually owe a fraction less of their homes’ value than Gen X homeowners do – 74.6 percent for millennials, compared to 75 percent for Gen Xers.
- In the Chicago area, home values fell 33.1 percent from peak to trough – more than the national average. The recession also lasted longer in the Windy City (the market bottomed a year after the U.S.), and the market recovery overall has been fairly slow. Gen X homeowners in Chicago also owe a slightly higher share of their homes’ value than millennials do: 77.3 percent to 76.5 percent.
Gen X homeowners are doing better in some areas, particularly the San Francisco Bay Area:
- In San Jose, the median Gen X homeowner with a mortgage has an outstanding balance of 47 percent of their home’s value – the only metro where mortgaged Gen X homeowners owe less than half of their homes’ value.
- Gen X homeowners in San Francisco are not far behind, owing 51.4 percent of their homes’ worth.
- Home values have grown substantially in both areas over the past five-plus years: Between January 2012 and May 2017, median home values grew by 78.2 percent in the San Francisco metro, and by 80.3 percent in the San Jose metro.
The strong growth in Bay Area home values highlights how important home value appreciation is in helping homeowners accumulate equity. In markets where home values grow at a double-digit annual pace (as they did in both San Francisco and San Jose throughout 2015 and into 2016), homeowners will owe less than half of their home’s value after just four years.
In a market that doesn’t see any home value growth, on the other hand, it would take homeowners close to 16 years to pay off half of their home’s value.
Related:

