Many home buyers in the United States purchase a home with the expectation that, when they sell, the home will have appreciated in value, and will be worth more than the current owner paid for the home. However, the housing bubble that reached its peak in 2007 and the subsequent decline in home values forced many homeowners to sell their home for a loss.
Here at Zillow Research, we set out to look at this issue over a longer time period—the past 35 years—to identify the markets where homeowners were most likely and least likely to incur a loss upon the sale of their home.
To see how home values moved over time, we chained the Zillow Home Value Index (ZHVI) backward in time to 1979 Q4 using the FHFA Home Price Index. For each of the 50 largest housing markets, we analyzed the change in median home values over 117 rolling five-year periods since the end of 1979. The “risk of loss” is the percentage of those periods that created negative returns for homeowners. In the case of ties between markets, those with the bigger drop in their worst years were ranked as riskier.
The housing markets with the highest percentage of negative five-year returns are Hartford (37 percent risk of loss), Providence (32 percent), Riverside (31 percent), Boston (30 percent) and Los Angeles (29 percent). The five least risky metro areas by the same metric are Buffalo (0 percent risk of loss), Pittsburgh (0 percent), Louisville-Jefferson County (3 percent), Raleigh (9 percent) and Nashville (9 percent).
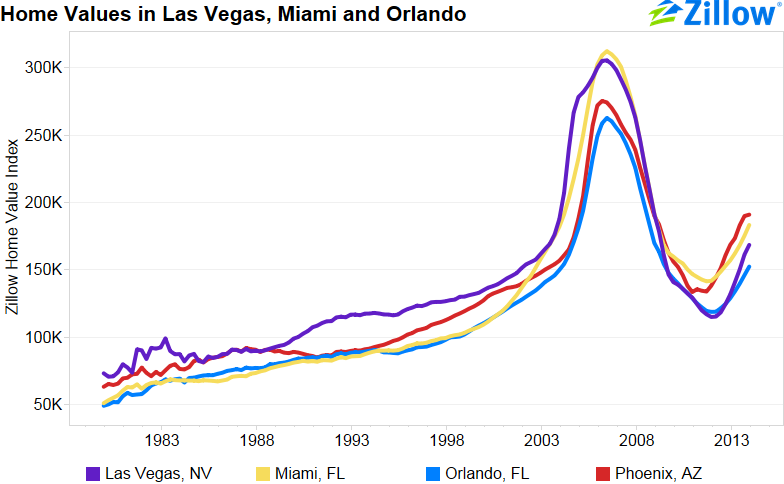
Some of the most risky areas may come as a bit of a surprise, as they aren’t known as places that were hardest-hit after the most recent housing bubble. While the measure of percent of negative returns identifies the metro areas where home values more consistently declined, it does not give extra weight to places that saw extreme declines post-bubble. If we look at the percent change in ZHVI in the worst year, we surface some of the usual suspects that were headline areas for home values declines and foreclosures after the peak in home values. The areas with the largest declines in home values, counting only the worst year per metro area, are:
- Las Vegas, with a 30 percent decline in home values from September 2008 to September 2009.
- Riverside, with a 29 percent decline in home values from March 2008 to March 2009.
- Miami-Fort Lauderdale, with a 28 percent decline in home values from December 2007 to December 2008.
- Orlando, with a 25 percent decline in home values from December 2007 to December 2008.
- Phoenix, with a 21 percent decline in home values from December 2007 to December 2008.
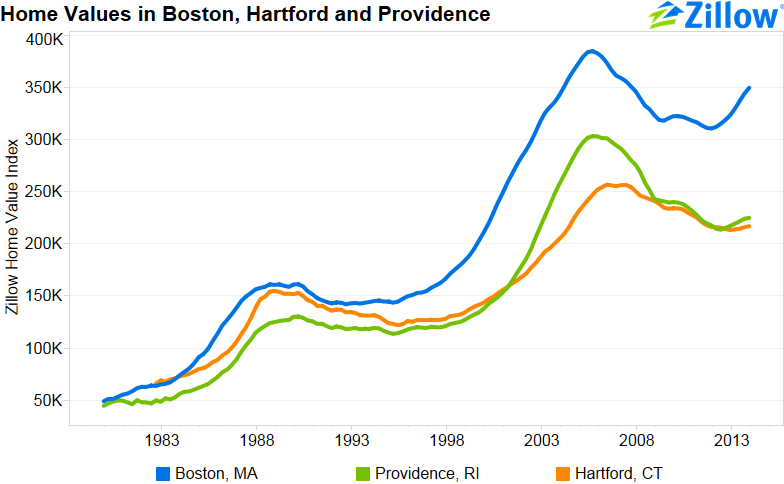
So what makes the New England metros shoot to the top of the list when looking at the areas with the most 5-year declines in home values? The answer is a small downturn in home values before the 2007 bubble. The following chart shows the Zillow Home Value Index in Hartford, Providence and Boston over the period analyzed. The three metros here also experienced a decline in home values, albeit much smaller than in the most recent housing bubble, in the early 1990s. The same phenomenon shows up in Southern California with a few differences. Comparing the path of home values in the largest cities in each region shows that Boston had a less extreme drop in home values. Home values showed a 12 percent decline from March 1990 to September 1992, and then were flat until March 1995 when they began to climb. On the other hand, home values in Los Angeles dropped 20 percent from June 1990 to June 1995 before rising again.
Due to the fact that they experienced another, longer period of home value declines, there were more periods of home value decline in those areas, shooting them to the top of the list in terms of riskiness. Areas like Las Vegas, Miami, Phoenix and Orlando didn’t experience the same downturn in home values in the early ’90s, but experienced a much more protracted decline that made them the most risky when looking at a single year.
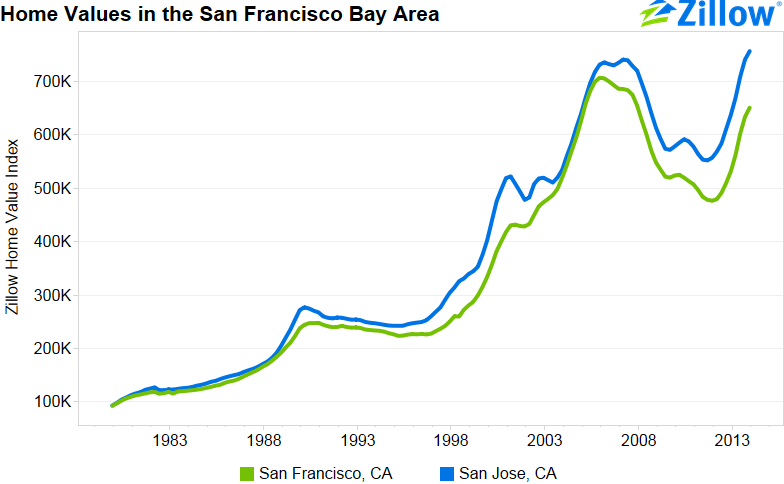
Another area with a region-specific pattern in home values is the San Francisco Bay Area, comprised of the San Francisco and San Jose metro areas. These areas have experienced three periods of homes values declines, with the first two periods for much shorter amounts of time when compared to Boston, Hartford and Providence. There was a small decline in the early nineties, followed by a short period of decline around the dot-com boom in 2000 and 2001, most noticeable in San Jose, and a period of decline following the most recent housing bubble.