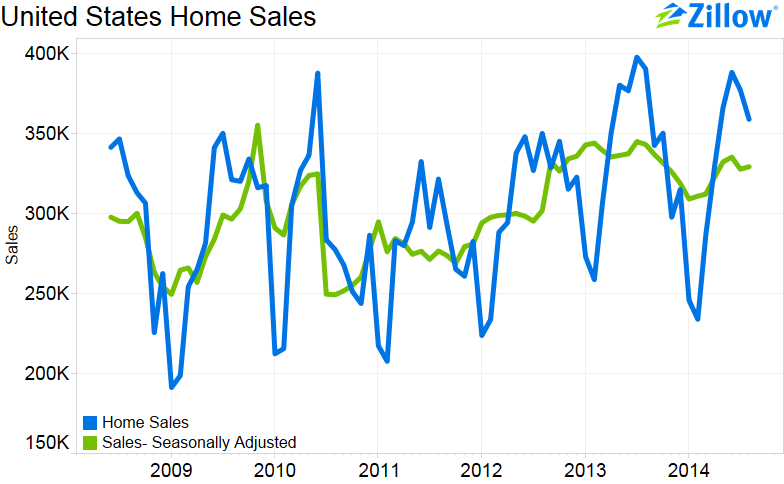
- Sales of both new and existing homes rose just 0.5 percent in August from July, to a seasonally adjusted level of 328,992, but fell 4.1 percent from one year ago.
- After rising throughout the first half of 2013, annual growth in sales volume has now fallen in each of the past 10 months.
- Smaller investor presence in many areas, coupled with more expensive homes for sale, could be driving sales volume down.
Sales volume of new and existing homes collapsed during the housing recession, bottoming in August 2010. But after rebounding through the first half of 2013, year-over-year sales growth has again turned negative as investors exit the market and inventory growth remains limited to the upper end of the market, beyond the reach of most entry-level and middle-tier buyers.
Sales of both new and existing homes rose just 0.5 percent in August from July, to a seasonally adjusted level of 328,992, but fell 4.1 percent from August 2013. Seasonally adjusted home sales bottomed at 249,085 sales in August 2010, but rebounded through the first half of 2013, peaking in July of last year. But since then, even as levels remain 32.1 percent above their 2010 lows, the pace of sales growth has slowed, and sales have now fallen year-over-year for 10 straight months (since November 2013). Zillow home sales data is available for download here.
Given larger trends in the housing market, this pattern is not surprising. After peaking in 2007 prior to the housing bust, home values bottomed out in late 2012. After the 2007 peak, sales volume was buoyed by the American Recovery and Reinvestment Act of 2009 (President Obama’s stimulus package), which offered home buyers a tax credit. But after this credit expired in 2010, sales volume quickly fell again.
During the recession and into the early stages of the recovery, cash buyers and real estate investors were also active in many markets, spurred by widespread availability of discounted foreclosed properties and generally falling home values of the kind conducive to cash sales. In 2013, fears started to emerge that the Federal Reserve would end its quantitative easing program, pushing up mortgage interest rates and making home purchases more expensive, potentially further stifling sales volume.
Annual sales growth began falling in November 2013, and throughout the remainder of 2013 and into 2014, many regions saw a decrease in the number of cash sales and the level of investor activity, which had been helping to boost sales volume. It is likely that this trend is continuing today. Meanwhile, inventory has increased as the number of homeowners trapped in negative equity has fallen, but much of this increased inventory is concentrated in the upper tier, where fewer people can afford homes.
As we leave the summer buying season, it remains to be seen if traditional home buyers will return to the market, or if external constraints including low levels of affordable inventory, rising prices and stubborn wage growth will continue to dampen home sales.
The story on the national level also plays out in many local markets. Of the top 25 metros areas covered by the Zillow, only 12 saw year-over-year growth in sales. Many of the hottest markets that have exhibited the most robust home value growth over the past year have also experienced significant slowdowns in sales. Home sales in San Francisco, Riverside, Seattle and Washington, D.C., fell in August, while Portland, Miami and Kansas City all experienced growth in the total number of sales.
