Home Values Grew Most in Markets With Strictest Land Use Regulations
Home values and job growth have both risen since 2010, but home values grew much more steeply in metros with stricter land use regulations.

Home values and job growth have both risen since 2010, but home values grew much more steeply in metros with stricter land use regulations.
• Home values and job growth have both risen since 2010, but home values grew much more steeply in metros with stricter land use regulations.
• Every additional 10 percentage points of job growth was associated with 25 percentage points of home value growth in heavily regulated metros, versus only 4.5 percentage points in lightly regulated metros.
Most U.S. metros have seen robust job growth in the years since the recession: The national workforce grew 12.5 percent, from 125 million jobs in January 2010 to more than 140 million in January 2017. Simultaneously, the housing market recovered from its crash, with the U.S. median home value rising 19.6 percent during those seven years, from $163,000 to $195,000.
But the national growth masks a great deal of variation among metropolitan areas. For example, in Denver home values rose 60.8 percent as jobs increased 22.6 percent, while in Atlantic City, N.J., home values fell 25 percent while jobs decreased 8.5 percent. Denver has become another tech hub and has a strong and diverse economy, while Atlantic City—once a tourist hub and one of the few places where you could go to gamble outside of Nevada—has struggled since the recession to regain an economic foothold, especially as rising seas and extreme weather have cause significant damage to the metro area.
Overall, job growth is strongly positively associated with home value growth: On average, every 10 percentage-point increase in jobs from 2010 to 2017 came with a 14 percentage-point increase in home values. But that relationship, it turns out, depends in part on how markets regulate residential land use and construction.
Most land-use regulations in the U.S. are determined locally. For instance, home builders in Houston face a different and generally easier environment in which to build than builders in San Francisco. Metros can be categorized into three groups: the metros with the most restrictive, moderately restrictive, and least restrictive land-useregulations[1].
Broadly speaking, the most restrictive metro areas include many large coastal markets such as New York, Los Angeles, Boston, and San Francisco. The moderately restrictive metros include several large markets in the interior and Gulf Coast, including Chicago, Dallas, and Houston. The least restrictive metros are mostly Midwestern or smaller markets, including Indianapolis, St. Louis, and Kansas City.
As the economy recovered and employment grew from 2010, the surplus of homes on the market turned into a shortage and home values began to rise. They tended to rise much more in the most restrictive metro areas, despite those places having only modestly higher job growth:
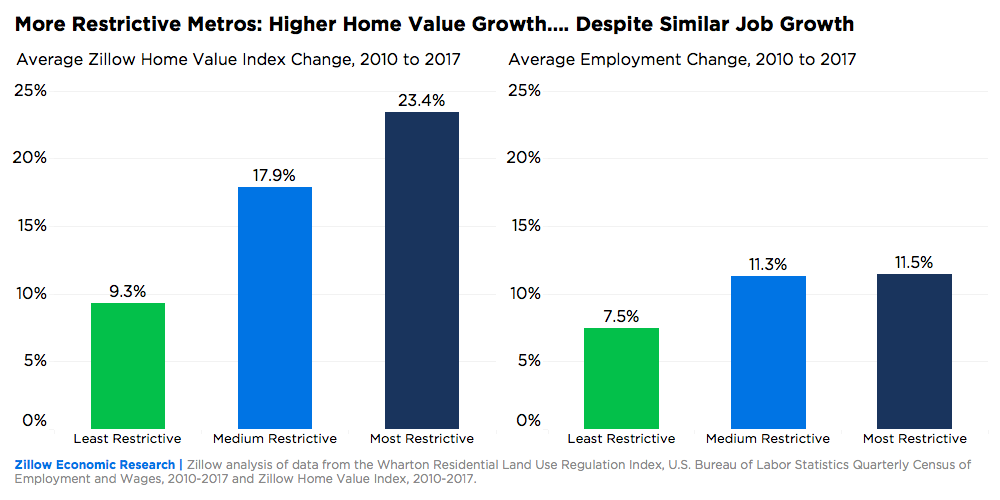
Home values in the most restrictive metropolitan areas grew an average of 23.4 percent, more than double the home value appreciation in the least restrictive metros (9.4 percent) and about one third faster than metros in the middle (17.9 percent). This occurred despite the most restrictive metros only seeing slightly higher job growth: 11.5 percent, compared to 7.5 percent in the least restrictive metros and 11.3 percent in moderately restrictive markets.
While job growth is positively associated with growth in home values in general, this relationship is amplified in more restrictive metropolitan areas.
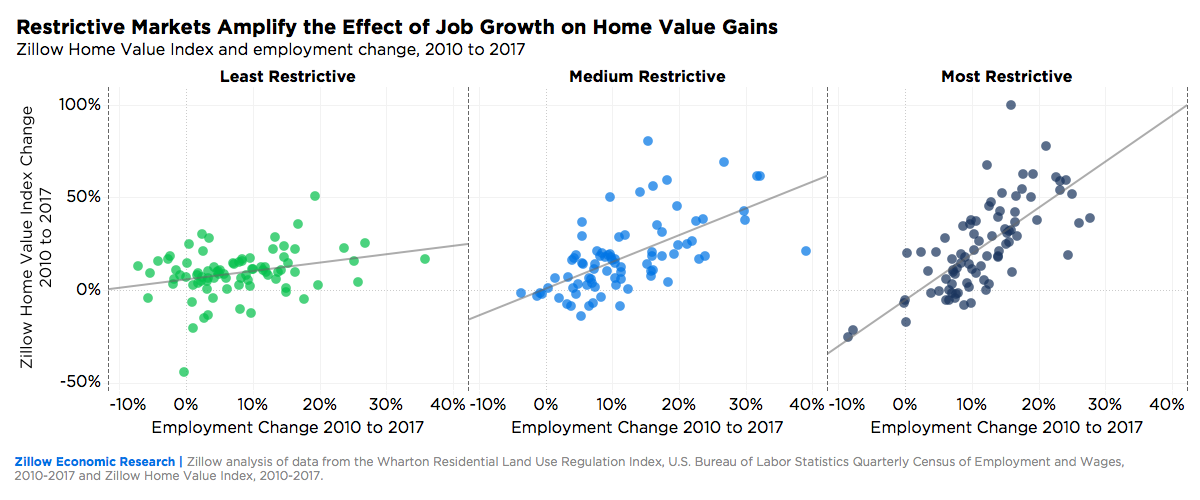
For every additional 10 percentage-point increase in employment, home values grew 24.9 percentage-points in metros with the most restrictive land use regulation. The same increase in jobs was associated with only 14.4 percentage-points more home value growth in moderately restrictive metros and 4.5 percentage-points in the least restrictive metros.
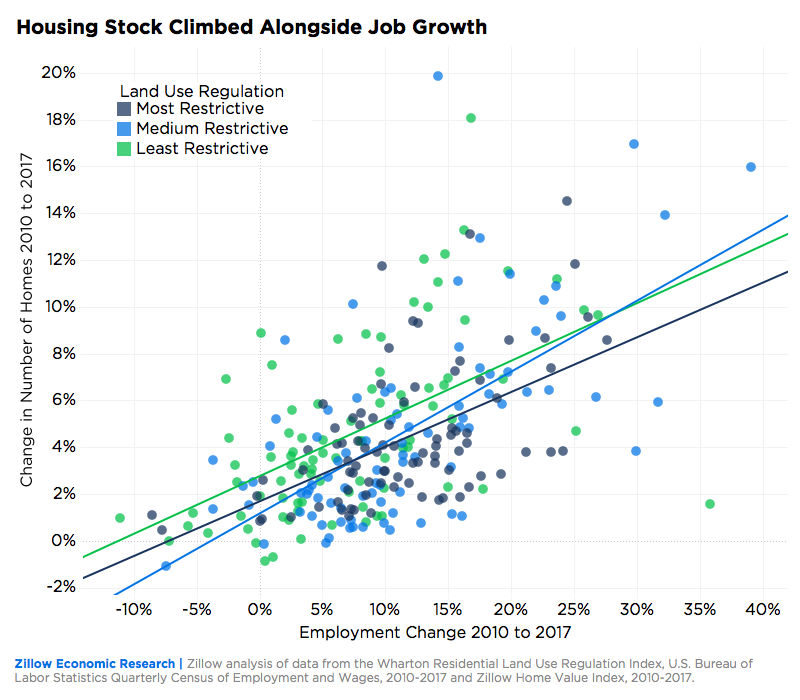
When land use regulations are more restrictive, builders seem to wait until home values reach a certain level before they can justify jumping through the regulatory hurdles or paying the high costs of permits. Nonetheless, when demand is high enough and buyers are willing to pay higher prices, builders find a way to deliver more homes. At every level of regulation, higher employment growth was associated with an increase in the housing stock.
Many factors influence home value growth in a market, and land use regulations are just one piece of the puzzle. Many of the most regulated metros also have limited land available to build on due to steep slopes or bodies of water nearby, which amplifies the supply shortage. A recent Zillow study found that Amazon’s construction of a second headquarters could have widely differing impacts on rents, depending on the metro’s characteristics.
On the demand side, job growth is only part of the picture, as population growth also encompasses non-working people such as retirees and children. Nonetheless, metropolitan areas might be able to accommodate job growth better by making it easier to build homes for incoming workers.
There have been some legislative efforts to ease land use regulations in the past year. The California State Senate recently voted down SB 827, a bill that would have drastically eased building regulations near frequent transit stops. California is home to several of the largest metros in the heavily regulated category, including Los Angeles and San Francisco, which also rank among the country’s least affordable housing markets.
To begin to address its housing shortage, California successfully passed legislation taking effect in 2017 to ease the rules governing construction of accessory dwelling units. At the municipal level, some cities with housing shortages are trying to make it easy to build more: Seattle is working to upzone (raise the permitted density in) some neighborhoods, allowing developers to build more units in exchange for including affordable units or paying into an affordable housing fund.
This analysis of regulations and home values indicates that such easing could alleviate some of the financial pressure on home buyers.
[1] The most comprehensive nationwide effort to summarize regulatory conditions is the Wharton Residential Land Use Regulation Index, which compiles the results of a survey sent to city planners across the country in 2007. The index is used to categorize all the metropolitan areas with survey responses into three groups: those with the most restrictive, moderately restrictive, and least restrictive regulations.
