Home Values Grow at Slowest Annual Pace in 15 Months (January 2018 Market Report)
January saw the slowest growth since November 2016 and follows a year in which homes regularly gained more than 7 percent from the prior year – including a 7.6 percent jump in May 2017, the fastest pace since June 2006 in the midst of the housing bubble.
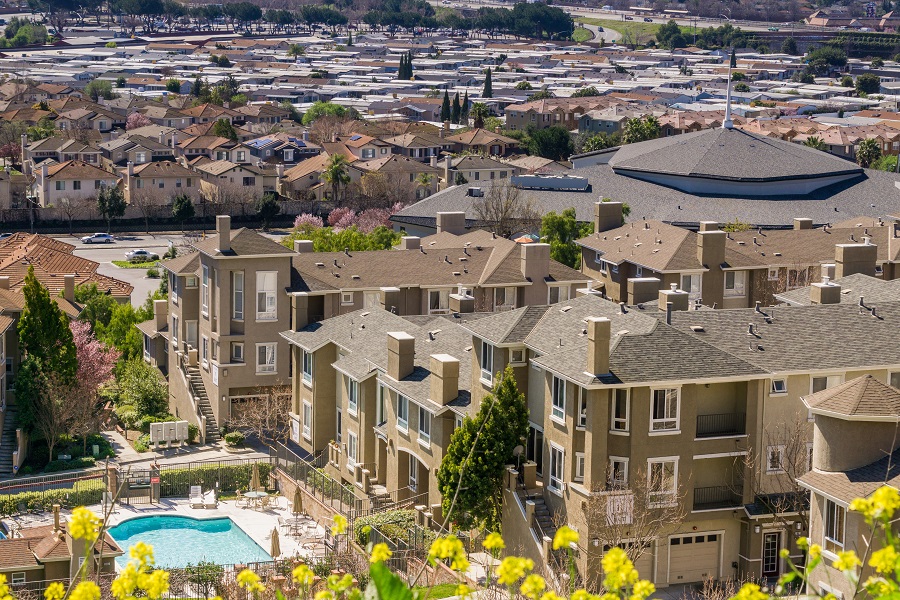
- Home values rose 6.7 percent in January from a year ago, to a median U.S. home value of $207,600. The highest home value growth was in San Jose, Calif., Las Vegas and Seattle.
- Accompanying the slowdown in home values is an uptick in mortgage rates, which have climbed steadily since the beginning of the year.
- Median rent posted its 65th consecutive month of increases, up 2.6 percent in January from a year ago to a median U.S. payment of $1,441 per month.
Even as demand for homes remains hot and inventory is historically low, national home values rose at their slowest annual pace in 15 months in January, up 6.7 percent year-over-year to a median home value of $207,600.
It’s the slowest growth since November 2016 and follows a year in which homes regularly gained more than 7 percent from the prior year – including a 7.6 percent jump in May 2017, the fastest pace since June 2006 in the midst of the housing bubble.
Among the country’s 35 largest metros, the top three for home value appreciation in January are out West: In San Jose, Calif., home values rose about 22.9 percent from last January – about three times faster than the area’s historic pace – to a median home value of $1,202,900. In Las Vegas, values climbed 14.3 percent to $249,000. And in Seattle, they grew 13 percent to $472,900.
The three major markets with the slowest annual growth are St. Louis, where values climbed 1.4 percent year-over-year to $151,900; Baltimore, with values up 1.6 percent to $261,400; and Washington, D.C., where values rose 1.7 percent to $387,200.
Accompanying the slowdown in home values was an uptick in mortgage rates, which have climbed steadily since the beginning of the year and ended Wednesday at 4.23 percent for a 30-year fixed-rate mortgage to a borrower with good credit. On Jan. 1, rates stood at just 3.83 percent.
Scarce Inventory
Slowing home value gains – measured among all homes, regardless of whether they’re for sale or not – do not translate directly into lower prices on homes actually listed for sale. The median U.S. list price climbed 8 percent year-over-year to $257,990 in January, in part because of how few homes are on the market – high demand, coupled with low inventory, means sellers can typically get away with charging a bit more.
Total inventory fell 9.7 percent in January from the prior year, continuing a three-year trend and putting the total homes for sale on Zillow nationwide in the first month of this year at approximately 1.2 million. The last time inventory climbed year-over-year was in January 2015.
The scarcity of lower-valued homes for sale continues to tighten. Inventory of homes valued in the lower third fell 17 percent in January from the previous year—compared to an 8.4 percent drop among mid-value homes for sale and a 4.9 percent decrease in higher-value homes for sale.
Builders are trying to address the shortage, with new home starts increasing about 7 percent over the past year – but they remain insufficient to meet demand.
Rents Still Rising
The median rent rose 2.6 percent since last January, to a median payment of $1,441 per month. It was the 65th consecutive month of year-over-year rent gains, dating to August 2012, a month when annual U.S. median rent growth was flat.
Sacramento, Calif., Riverside, Calif., and Seattle reported the highest year-over-year rent appreciation among the 35 largest housing markets. Median rent in Sacramento climbed 8.3 percent to a Zillow Rent Index (ZRI) of $1,845; in Riverside, it rose 6.3 percent to $1,861; and in Seattle, 5.1 percent to $2,203.
Two of the top 35 markets experienced rent decreases: In Pittsburgh, the median rent fell 1.5 percent to $1,054 a month, and in Austin, it dropped 0.5 percent to $1,686.
