The U.S. homeownership rate fell to 63.7 percent in Q1 2015, according to the U.S. Census Bureau, the lowest rate since the beginning of 1993. But the actual share of American households that own a home is probably – slightly – higher.
The homeownership rate is traditionally calculated as the percentage of households that report owning the home in which they live. The national homeownership rate, as calculated, is highly influential in national policy, and is widely cited and analyzed. But it can also be misleading, since it does not capture the full population of households that own homes. Some, including some renters, own homes they do not live in, and are technically homeowners, even if they reside in a rented structure.
Using data from the Census Bureau’s March Current Population Survey – a different survey than that used to calculate the more traditional, quarterly homeownership rate – we identify households that rent, but also report receiving rental income.[1] Assuming these households are not simply renting with the aim of turning around and subletting to another tenant and renting somewhere else, we can add these “renter” households to the universe of homeowners when calculating the homeownership rate.
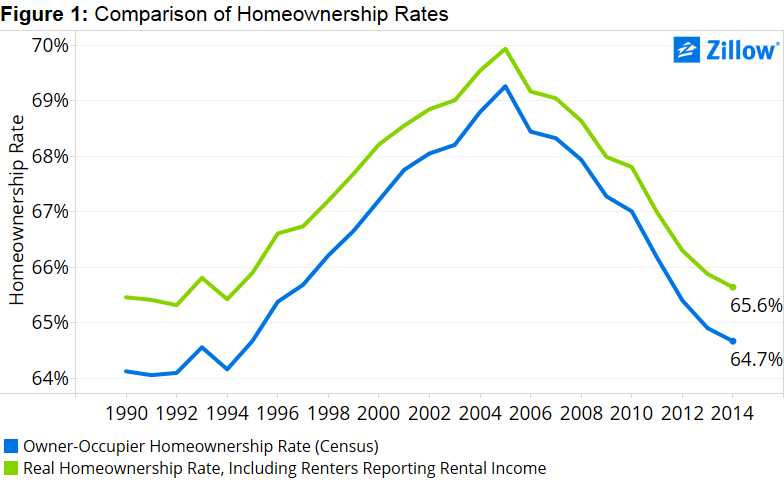
The inclusion of hidden homeowners only modestly increases the homeownership rate, in most years by 1 to 2 percentage points. But that 1 to 2 percentage-point difference could represent hundreds of thousands of homes (figure 1).
[1] Zillow analysis of data from the U.S. Census Bureau’s March Current Population Survey (CPS) made available by the University of Minnesota, IPUMS-USA.
