Dethroned: Why Hartford Claims the Crown as 2026’s Hottest Market Over Buffalo

Key Findings:
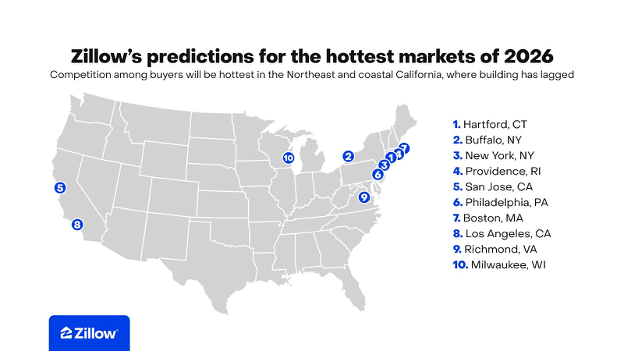
Zillow expects Hartford, Connecticut, to be the nation’s hottest housing market in 2026, with Buffalo, New York, Providence, and San Jose rounding out the top five. This means the previously fourth-ranked hottest market has jumped up to dethrone Buffalo, Zillow’s hottest market two years running. A strong home price forecast and demand that far outpaces supply are common threads among what should be the most competitive markets for buyers in 2026.
Nationwide, Zillow forecasts relatively slow and steady growth for both home values and sales in 2026. Affordability will remain a challenge — whether that improves for potential buyers depends on location and unpredictable mortgage rates. Fortunately for buyers, inventory should continue to recover from a deep pandemic-era deficit.
Common among all of the hottest markets for 2026 is a marked lack of choices for buyers, boosting competition for the listings that do hit the market. Among the five hottest metros for 2026, San Jose’s inventory is closest to pre-pandemic levels — though there’s still a 27% deficit, which is deeper than the 17% deficit nationwide. Hartford has the largest shortfall in the country, with 63% fewer listings on the market than in 2018-2019.
Attractive listings have been fiercely contested in Hartford, where the typical home was on the market for just about a week and most homes sold above list in 2025, buoying price growth. Hartford has the strongest home price forecast amongst the top five hottest markets and the lowest time on market, indicating that buyers should be prepared to come with a strong bid in 2026.
Zillow forecasted Buffalo to be the hottest market in 2024 and 2025, and both calls were on-the-money. Sellers held a strong advantage in negotiations there throughout last year, giving it the highest competition value on Zillow’s market heat index among major metros.
New York’s place at third on the list is attributed to a positive home price forecast, strong employment, and just 13.5% of its listings having a price cut, the lowest among any of the five hottest markets on this year’s list.
Here’s a closer look at what shot markets to the top of the list:
Home value appreciation flattened out nationwide in 2025, with half of major markets seeing home values drop. As the market adjusts to a new normal of 6% mortgage rates, Zillow forecasts home prices in the majority of markets (37) to rise this coming year.
Among the five hottest markets of 2025, all have an above-average outlook for home value appreciation. At the upper end of this range is our No. 1 market, Hartford, with forecasted home value growth of nearly 4%, following 4.3% appreciation over 2025. This eclipses Buffalo’s 2.5% forecast for 2026.
The inflow of new listings only recovered slightly over the course of 2025, but an increasing time on market helped overall inventory levels inch back towards pre-pandemic levels. It’s likely that these low-inventory markets, where homes sold quickly in 2025, will continue to experience outsized demand relative to supply in 2026. The markets with the fewest listing days per home in 2025 – those where inventory was lowest and sold the fastest – were Hartford, St. Louis, and Cincinnati, with St. Louis being a new addition from last year.
Newly incorporated into the index this year are two measures of buyer competition: the share of listings with a price cut, and the share of homes that sold above list price. Metros where it is not likely for sellers to need to cut their price and where sellers are likely to get offers above their listing price can be signs of bidding wars. Hartford, Buffalo and San Jose each have over 60% of homes that sold above list, the highest of the markets considered. When it comes to the likelihood of seeing price cuts, New York is the toughest market, with only 13.5% of listings with a price cut. This ranges up to 33% in Phoenix.
The final index was based on the following data:
Metrics were normalized given the available metro-level data to standard deviations from the mean. The final index is an average across metrics, with standardized home price appreciation acceleration down-weighted by half.
Inventory and velocity are represented by listing days per home, using published Zillow data for Median Days to Pending and New Listings.
Job market and building data took the ratio of the change in employment to the total permitted residential structures. Total non-farm employment (seasonally adjusted) comes from the U.S. Bureau of Labor Statistics Current Employment Statistics survey. We used the two-year change in employment Aug. 2023 – Aug. 2025.
Building permit data comes from New Private Housing Structures Authorized by Building Permits. We sum over the two-year period Aug. 2023 – Aug. 2025.
Unlike last year, the latest IPUMS data showing expected household growth was not available due to delays associated with the government shutdown. We replaced our measure of underlying demographic pressure in favor of two different measures of market competition, the share of homes sold above list, and the share of listings with cut. The share of homes sold above list is an average of the monthly values from September 2024 – September 2025. The share of listings with a price cut is an average of the monthly values from October 2024 – October 2025. Both are created using published Zillow data.
