Oil, Houston’s Housing Market & Lessons From Other One-Horse Towns

On Sept. 16, Zillow’s Housing Roadmap to 2016 tour stops in Houston, one of America’s fastest-growing cities and also — mostly — one of its most affordable. But despite its successes, Houston is not immune to the many challenges facing other rapidly growing American cities, including rising income inequality, emerging rental affordability concerns and ongoing efforts to diversify its economic base.
In advance of our visit, Zillow Research will be publishing a series of Houston-focused research briefs aimed at shedding light on some of the unique trends we’re observing in the area. All of our Houston research can be found here, and we encourage you to please join us on Sept. 16 if you can. If you can’t, please join in the conversation on social media with the hashtag #HousinginAmerica.
A city’s economic development is often a gamble, particularly when a given city bets on a single industry as its niche and goes all in on supporting that sector. America is full of cities in which those narrow bets have both paid off and lost big, and a few can potentially offer lessons to the city of Houston as it endures still more volatility in its main niche – energy.
Of the 26 Fortune 500 companies headquartered in Houston, 23 are related to the energy sector. Just about a year ago, on Sept. 1, 2014, West Texas Intermediate crude prices closed the day at $90.90 per barrel. But by the end of 2014, they had collapsed to $57.69 per barrel, and in August fell below $40 per barrel for the first time since the depths of the recession in early 2009.
This latest swoon in oil prices may not last, and it could still be too soon to determine the full impact of a weaker energy market on Houston’s otherwise very robust housing market. But examining the experiences of a pair of markets with wildly different trajectories in recent years – San Francisco and Atlantic City – is useful in highlighting where the one big bet strategy could take Houston in the years to come.
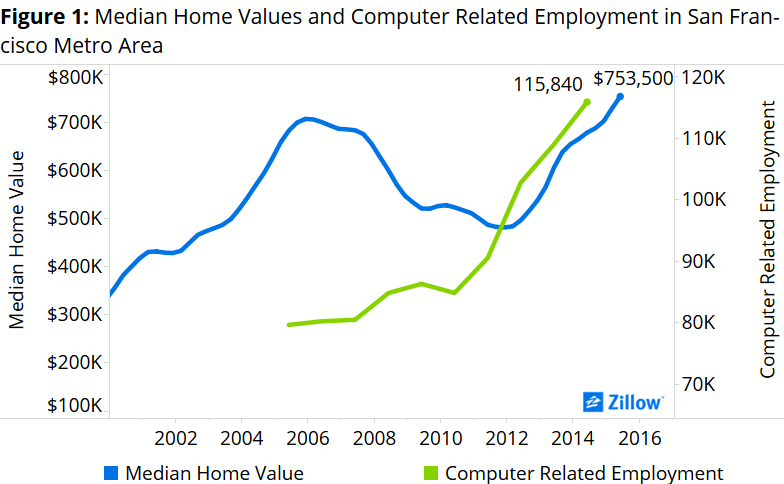 Seemingly every day, we hear about a company that wants to become the Uber of this, or Facebook for that. Most of that action is taking place in and around San Francisco, and over the past decade computer-related employment has taken off in the area, growing more than 36 percent from 2010 to 2014 (figure 1).
The technology industry is broader than computer programmers and software developers, but they provide a useful proxy for the industry as a whole. And unsurprisingly, the swell of well-paying jobs and blockbuster IPOs has generated a large demand for housing in the city by the bay. Coupled with anemic levels of new construction in the area, that demand has been pushing prices ever-higher, with appreciation rates of almost 30 percent over those same four years (from 2010 to 2014).
This growth certainly comes with challenges, and the seemingly constant struggle to provide affordable housing for lower-income residents shows no signs of abating in the Bay Area. But this growth, attributable in large part to the city’s very dense tech sector, has certainly been a boon for the city as a whole. Many cities nationwide would likely be more than willing to trade their problems for San Francisco’s.
But putting all your money on the same horse can also be a risky proposition, and it’s likely no one knows that better than Atlantic City’s struggling bookies, croupiers and pit bosses.
 In 1976, Atlantic City decided to hitch its wagon to the casino industry and legalized gambling in an effort to re-attract tourists and thrill-seekers to its wide beaches and famed boardwalk. And the bet paid off, at least initially. The city became one of the most popular tourist destinations in the country, and a boom in condominium construction soon followed to meet the demand for permanent residences and second homes.
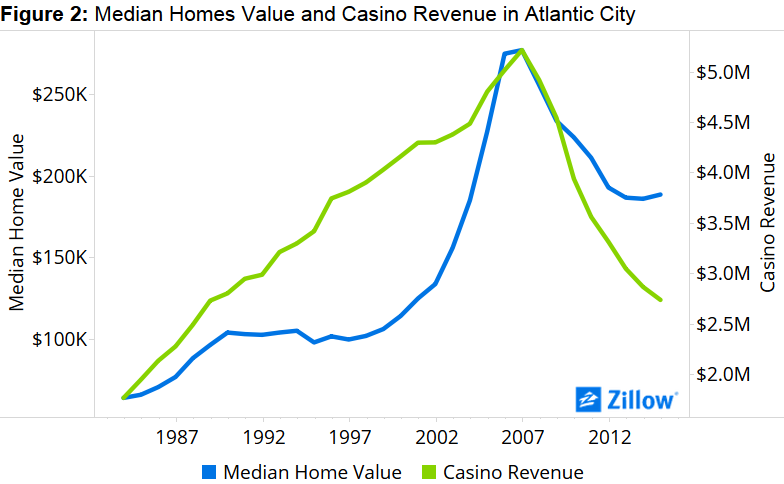
But when the gamblers started to turn away in favor of a new breed of nearby casinos in Connecticut, New York and Pennsylvania, the bottom fell out, and casinos in Atlantic City began to shut their doors as gaming revenue plummeted. After years of steady increases, casino revenue dropped by almost half from 2006 to 2014, with home values quickly following suit (figure 2). Over the same period, home values in the Atlantic City metro fell more than 30 percent, hit by an unfortunate double-whammy of a fading main local industry and a withering, nationwide, housing-driven recession.
But while home values nationwide have been largely on the upswing over the past few years in the wake of the recession, home values in Atlantic City show no signs of recovering soon. Atlantic City now finds itself in a difficult position, with one of the highest unemployment rates in the country and a local economy built on a quickly shrinking industry.
Houston, of course, isn’t San Francisco, nor is it Atlantic City. But it does have a few features in common with both: Explosive recent growth à la San Francisco, and a reliance on a volatile (at best) main industry, like Atlantic City.
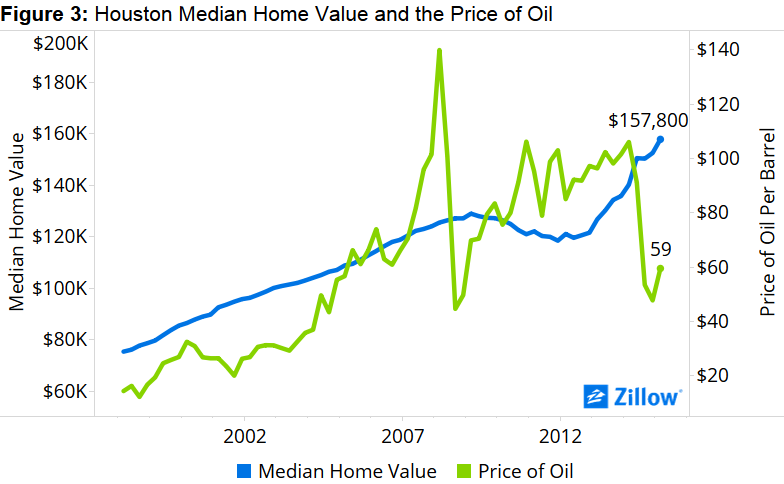 For a while, Houston’s bet on the energy sector seemed like the smart money. In the 1990s, oil prices began a largely uninterrupted upward march, before succumbing to a continued period of wild volatility at the outset of the recession. This booming industry largely insulated Houston home values from the housing crisis most of the nation went through. Nationwide, home values fell 29 percent from 2007 to 2012, but in Houston home values barely moved over the same period (figure 3).
Even now, after roughly a year of slumping oil prices, Houston home values continue to grow quickly, though the pace of growth is starting to fade. But the rental market in Houston and other nearby, oil-dependent communities is already starting to suffer as oil prices stay low and energy-sector employment falters.
On the eve of the latest, sustained round of oil price declines – in August 2014 – rents per square foot in the five Texas metros where oil and gas workers account for the largest share of employment (Beaumont, Corpus Christi, Houston, Midland and Odessa) were growing at a more than 10 percent annual pace. At the same time, in the five Texas metros where oil and gas workers account for the smallest share of employment (Amarillo, Austin, Brownsville, Dallas-Fort Worth and Lubbock), rents per square foot were growing at an annual pace of 2.9 percent.
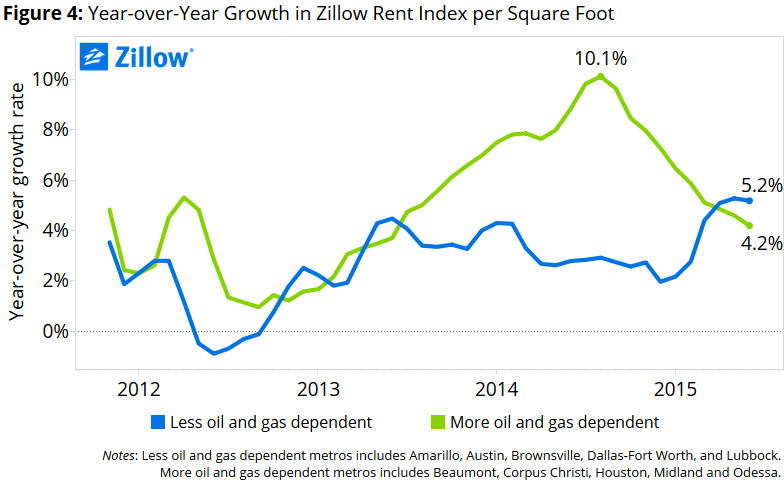 Since then, however, rent growth has come down dramatically in the more oil-dependent metros. Median rent per-square-foot is growing 4.2 percent annually in the more oil-and-gas-dependent Texas metros, compared to 5.2 percent annually in the less oil and gas dependent Texas metros (figure 4). In April, the annual growth rate of rents in less oil-and-gas-dependent metros surpassed the growth rate in more oil-and-gas dependent metros for the first time in almost two years.
When we compare the share of workers employed in “mining, quarrying, oil and gas extraction” occupations[1] across Texas metros with the average year-over-year growth rate in rents per-square-foot during the first six months of both years, 2014 looks very different from 2015 (figure 5). In the first half of 2014, Texas metros with more oil and gas workers tended to have faster rental appreciation. But through the first half of 2015, the opposite was true.
It may be too soon to tell how continued volatility in oil markets will impact the for-sale housing market in Houston. It also may be that Houston’s ongoing effort to diversify its economic base is paying dividends and helping the city to both grow rapidly and attract a broader range of workers to further insulate the city from oil’s volatility.
But movements in the rental market help prove the city is still not immune to the whims of the oil market. We look forward to hearing what steps are being taken to help mitigate this trend on Sept. 16.
[1] Employment data from the U.S. Census Bureau’s American Community Survey, 2013 made available by the University of Minnesota, IPUMS-USA.
