Housing in Houston: Home Values & Rents Still Growing, but Slowing

On Sept. 16, Zillow’s Housing Roadmap to 2016 tour stops in Houston, one of America’s fastest-growing cities and also — mostly — one of its most affordable. But despite its successes, Houston is not immune to the many challenges facing other rapidly growing American cities, including rising income inequality, emerging rental affordability concerns and ongoing efforts to diversify its economic base.
In advance of our visit, Zillow Research will be publishing a series of Houston-focused research briefs aimed at shedding light on some of the unique trends we’re observing in the area. All of our Houston research can be found here, and we encourage you to please join us on Sept. 16 if you can. If you can’t, please join in the conversation on social media with the hashtag #HousinginAmerica.
Texas didn’t have as deep a housing recession as many other areas nationwide. The state and many of its individual markets lost some housing value during the bust years, but largely avoided the kind of rollercoaster ride experienced by markets like Phoenix or Las Vegas. Texas home values also didn’t have a steep run-up in the early part of last decade prior to the downturn. Home values rose steadily during that time, but not outrageously, averaging 5.2 percent annual growth from 2000 through 2006.
Median home values in the Houston metro itself bottomed out at the end of 2011, and grew at rates exceeding 10 percent per year for most of 2013 and 2014, with appreciation only recently slowing down. In July, median home values stood at $161,000 – up 7.5 percent from a year ago. Houston’s priciest homes in July were located to the immediate south and east of the city’s downtown, with median prices topping $1 million in ZIP codes 77027 and 77005, according to data from the Houston Association of Realtors (figure 1).
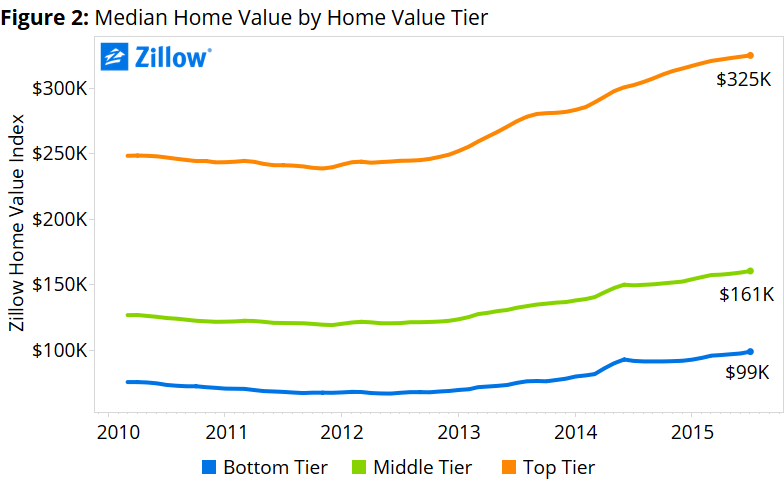 Homes of all kinds have appreciated strongly in Houston recently, but particularly at the bottom end of the market. Homes valued in the bottom third of all homes experienced above-average annual appreciation of more than 17 percent in 2014, erasing much of the losses incurred during the housing bust (figure 2).
Given that Houston did not have a deep housing recession, it also does not have to contend with as much negative equity as residents in harder-hit markets like Las Vegas, Atlanta, Phoenix and Sacramento. More than half of all homeowners with a mortgage were underwater in these harder-hit markets in 2012 Q1, when negative equity was at its worst, compared to a national peak rate of 31.4 percent. Nationally, negative equity has fallen by more than half since then, to 14.4 percent of all homeowners with a mortgage as of 2015 Q2.
Negative equity in the Houston metro peaked at 31.3 percent in Q4 2011, and has since fallen to near-normal levels of 6.4 percent as of Q2 2015. Still, despite an overall low level of negative equity in the larger Houston area, some communities were hit harder than others. Negative equity in the Houston metro ranges from a negligible rate of 2.4 percent in ZIP code 77538 to more than 36 percent in ZIP code 77010. Communities just beyond the inner loop of Houston to the northwest and west of downtown have almost no negative equity to speak of, while large swathes of the metro to the south and northeast of downtown still struggle with negative equity rates in excess of 10 percent (figure 3).
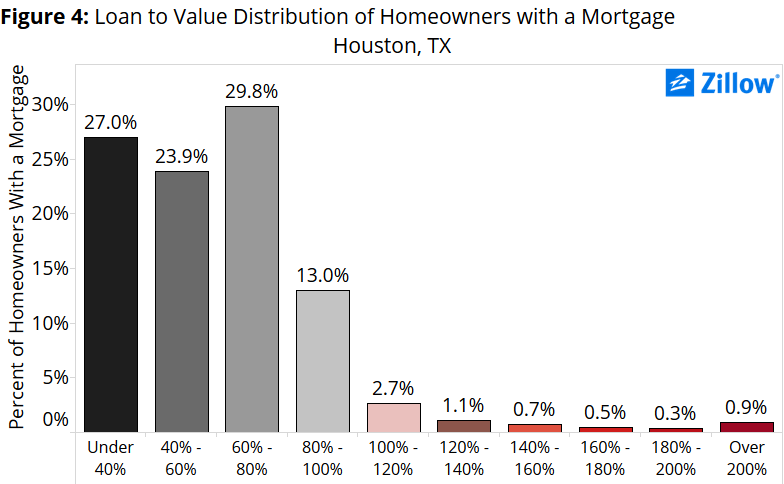 As in most other markets nationwide, negative equity in Houston is largely concentrated among homes valued in the bottom one-third of all home values. Among bottom-tier homeowners in Greater Houston, 9 percent of those with a mortgage are underwater, almost double the share of top-tier homeowners with a mortgage (5 percent). Unlike some other markets, Houston-area homeowners in negative equity are not particularly deep underwater. Just 0.9 percent of mortgaged Houston homeowners owe more than double what their home is worth to their lender (figure 4), half the rate of the U.S. as a whole (1.8 percent).
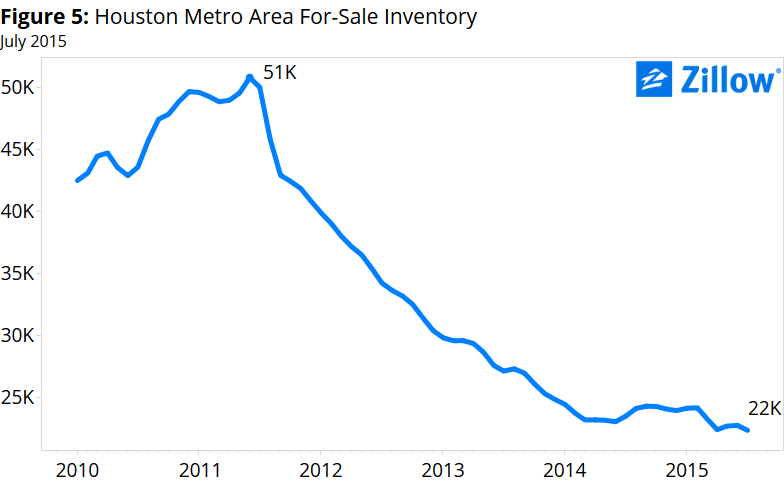
 Despite low levels of negative equity – which can exacerbate inventory problems by keeping homeowners out of the market that might otherwise list their homes for sale – Houston still has low inventory of for-sale homes, especially compared to the market’s mid-2011 peak (figure 5).
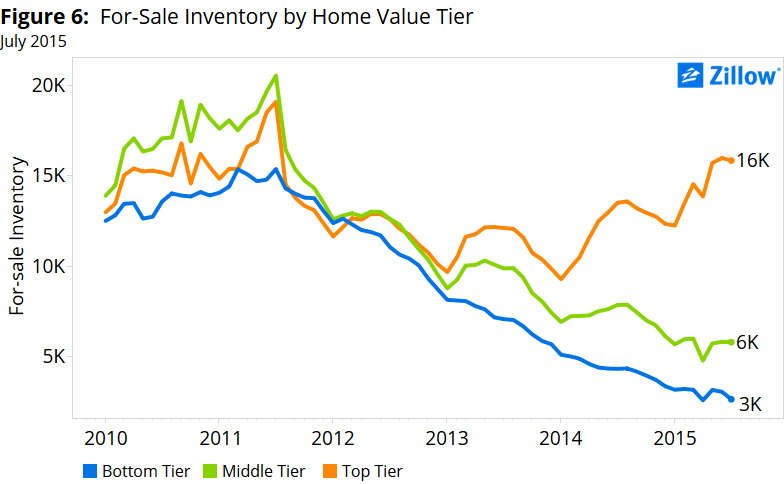
Supply is tightest among homes valued in the bottom one-third of home values. The inventory of higher-end homes have actually experienced an uptick in supply over the last 2 years, and supply is almost back to recent peak levels (figure 6). A lack of supply at the bottom end of the market has been helping to drive strong home value appreciation, and has contributed to a difficult local market for first-time homebuyers, in particular.
The low supply of starter homes is especially unfortunate in light of strong overall mortgage affordability in Houston. Currently, a potential homebuyer in the Houston area should expect to spend roughly 12 percent of her monthly income on a mortgage, down from 15 percent historically. The current U.S. average is about 15 percent, compared to 21 percent historically. Houston’s mortgage affordability looks especially attractive in light of fairly poor rental affordability in the area. Currently, a renter can expect to spend almost three times as much of their income on rent (31 percent) as on a typical mortgage (figure 7).
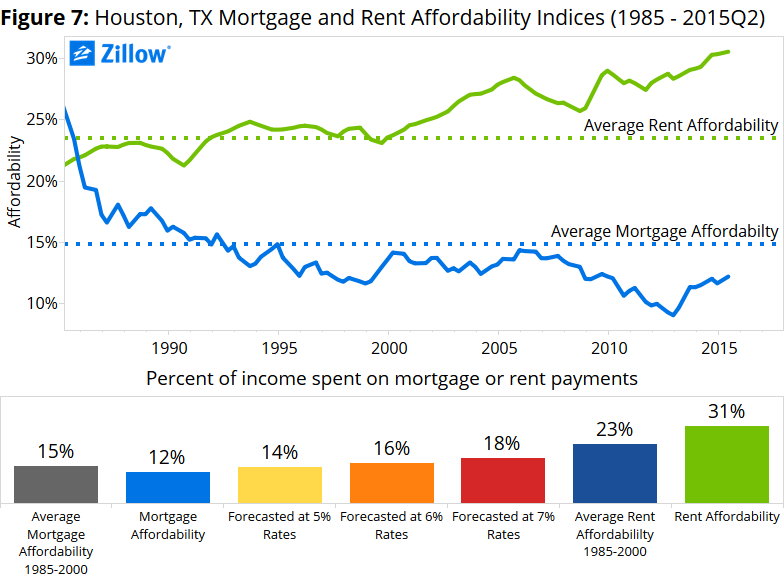
Houston’s rental market has been very strong, with rents up 5.4 percent year-over-year in July, although the pace of rental growth has begun to fall sharply in recent months perhaps in response to falling oil prices, upon which much of Houston’s economy is based. Given high rents and attractive mortgage affordability, more renters are expected to make the transition to homeownership – although the aforementioned inventory constraints are not making it easy.
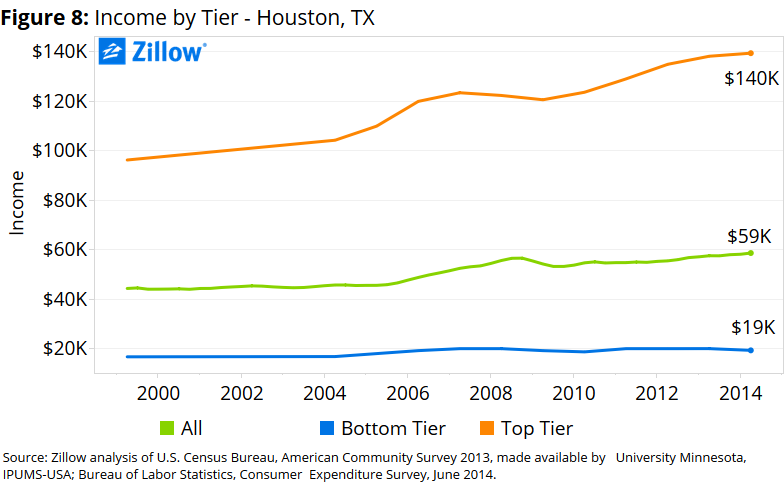
 Additionally, income growth for the bottom one-third of earners has been roughly flat over the past 15 years, while incomes for the top one-third of earners have grown steadily – today, the top third of earners makes more than 7 times as much as the bottom third (figure 8).
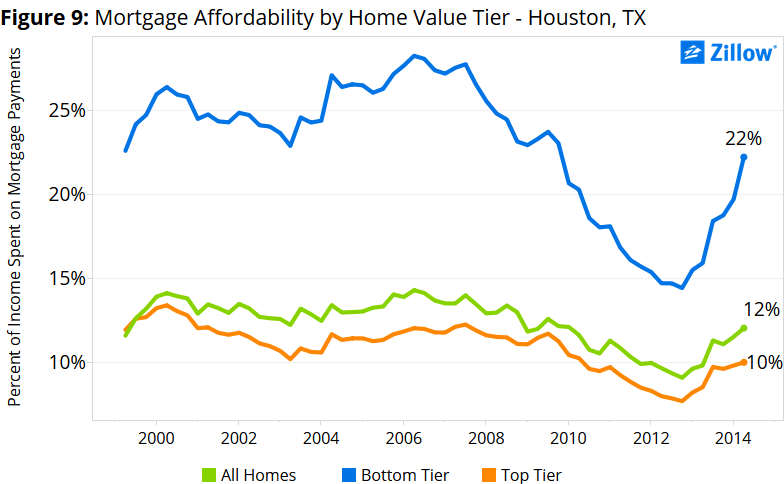
This income gap will become a larger problem as mortgage rates start to rise and housing costs consume a larger share of income. Even over the last 2 years, the bottom third of homebuyers has experienced a steep jump in the share of income necessary to purchase a home – up from 15 percent in mid-2012 to 22 percent in mid-2014. Top-tier earners, even seeking more expensive top-tier homes, should only expect to spend about 10 percent of their monthly income on a mortgage (figure 9).
Given current conditions in the Houston market, there are interesting local trends around how people are searching for homes[1]. Home searchers already within the Houston area tend to search in the ring of ZIP codes just outside of formal city limits. An exception is along the Katy Freeway (Interstate 10) that runs into downtown Houston, which features a relatively high concentration of searchers. These highly sought areas are also typically those with higher home values.
Searchers from the rest of Texas and the rest of the United States displayed similar search trends to searchers with the Houston area, with the exception of a higher concentration of searches along the coast, especially Galveston Island. These searchers are likely seeking a second or vacation home. Searchers coming from abroad tended to concentrate their home searches in the ring of ZIP codes to the north and west of the city. Among international searchers, Canadians, Brits, Mexicans and the Chinese showed the most interest in Houston homes. This international demand, coupled with domestic demand, is also helping drive home values up in those areas.
[1] Page-view data represents users of Zillow.com looking at for-sale and not-for-sale homes between February 2015 and July 2015
