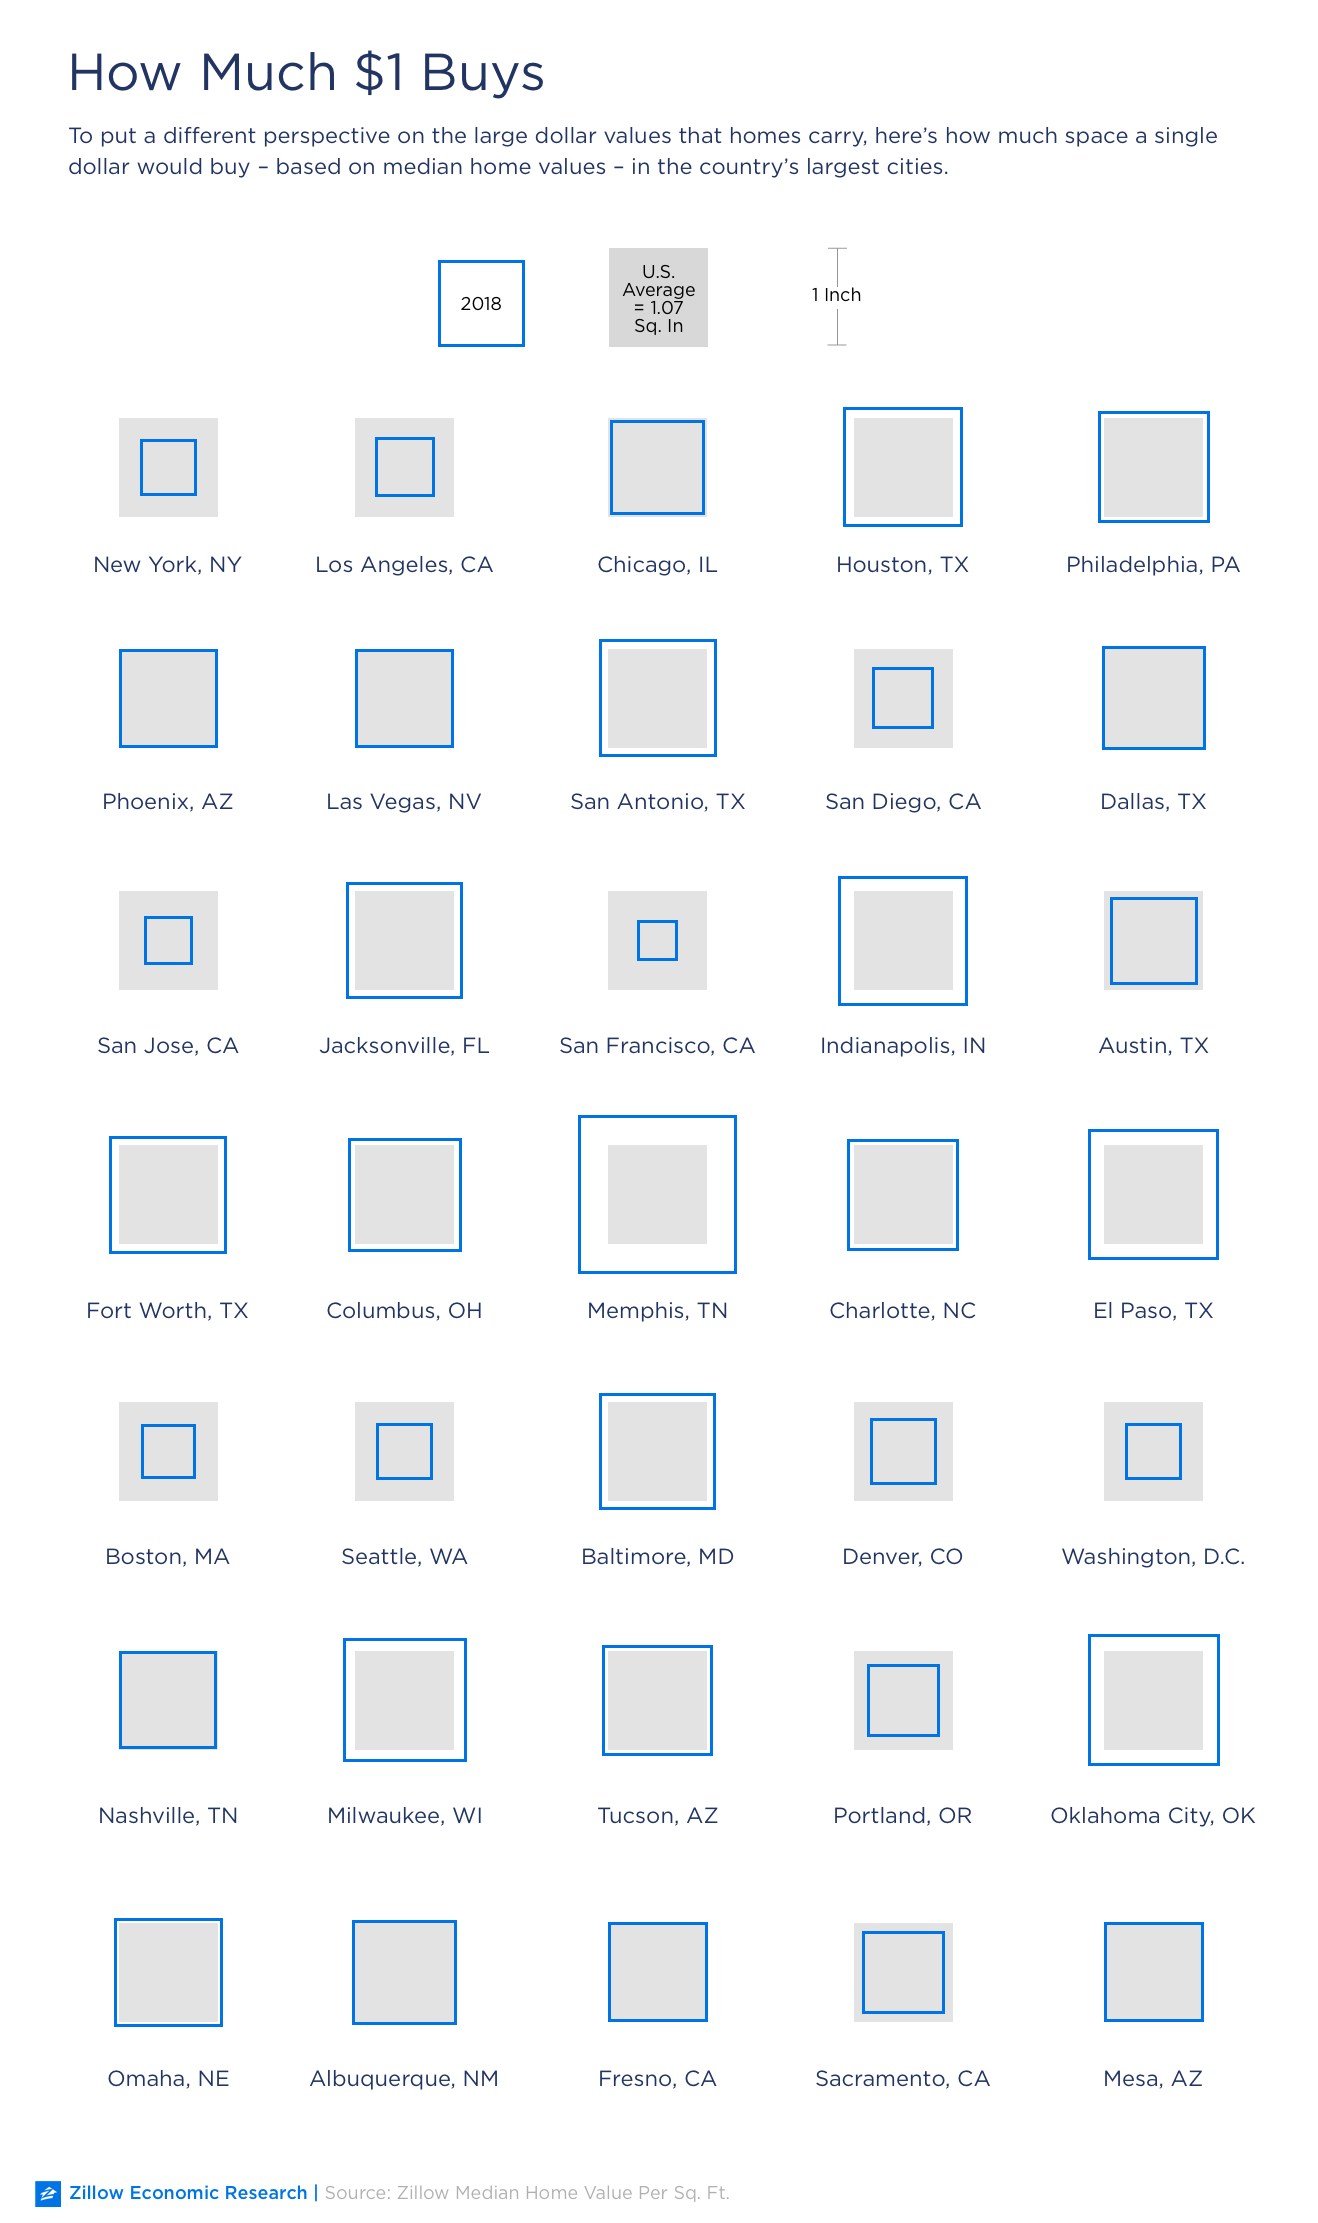
How Much Space Can You Get for a Dollar?
For the typical U.S. home, a dollar buys 1.1 square inches of space. In Los Angeles, it's just 0.3 inches. In Memphis, 2.5 inches. Here's a graphic representation of how much space a single dollar would buy across the country.
As home values continue to rise — reaching a U.S. median of $218,000 in July, with nearly 200 markets posting median home values of $1 million or more — it can be hard to grasp just how much space home buyers get for their money from city to city.
To simplify that question, here’s a graphic representation of how much space a single dollar would buy in cities across the country. For the typical U.S. home, a dollar buys 1.07 square inches of space. In San Francisco, it’s just 0.14 inches. In Memphis, 2.53 inches.
Check out how much space a dollar buys over time in major markets.
Here are the numbers to go with the graphic:
| City |
Zillow Home Value Index[i] (ZHVI) |
YoY ZHVI Change |
Square Inches for $1 in 1998 |
Square Inches for $1 in 2008 |
Square Inches for $1 in 2018 |
| United States |
$218,000 |
8.0% |
2.09 |
1.23 |
1.07 |
| New York |
$672,200 |
6.4% |
1.01 |
0.38 |
0.28 |
| Los Angeles |
$674,800 |
7.2% |
1.18 |
0.43 |
0.31 |
| Chicago |
$225,600 |
2.1% |
1.58 |
0.74 |
0.85 |
| Houston |
$179,400 |
7.0% |
2.57 |
1.95 |
1.40 |
| Philadelphia |
$150,300 |
11.4% |
3.79 |
1.55 |
1.22 |
| Phoenix |
$232,700 |
9.0% |
2.25 |
1.12 |
0.95 |
| Las Vegas |
$262,200 |
15.4% |
1.82 |
1.08 |
0.94 |
| San Antonio |
$168,600 |
8.1% |
2.62 |
1.89 |
1.37 |
| San Diego |
$623,000 |
6.5% |
1.13 |
0.50 |
0.34 |
| Dallas |
$194,100 |
13.8% |
2.48 |
1.80 |
1.04 |
| San Jose |
$1,110,800 |
23.5% |
0.76 |
0.37 |
0.20 |
| Jacksonville |
$ 166,500 |
10.3% |
2.67 |
1.44 |
1.35 |
| San Francisco |
$1,366,000 |
9.2% |
0.56 |
0.24 |
0.14 |
| Indianapolis |
$130,700 |
10.9% |
2.18 |
1.85 |
1.67 |
| Austin |
$350,200 |
7.9% |
1.43 |
1.15 |
0.73 |
| Fort Worth |
$185,200 |
10.4% |
2.62 |
2.09 |
1.36 |
| Columbus |
$147,000 |
9.0% |
2.00 |
1.62 |
1.27 |
| Memphis |
$83,300 |
8.3% |
3.13 |
2.88 |
2.53 |
| Charlotte |
$213,400 |
11.0% |
2.03 |
1.58 |
1.21 |
| El Paso |
$124,200 |
3.7% |
2.72 |
1.78 |
1.69 |
| Boston |
$588,000 |
6.3% |
1.01 |
0.46 |
0.26 |
| Seattle |
$753,600 |
8.1% |
1.03 |
0.47 |
0.28 |
| Baltimore |
$117,100 |
33.2% |
2.88 |
1.21 |
1.33 |
| Denver |
$416,100 |
7.6% |
1.33 |
0.79 |
0.41 |
| Washington |
$569,100 |
5.0% |
1.33 |
0.41 |
0.28 |
| Nashville |
$256,700 |
10.1% |
2.12 |
1.47 |
0.92 |
| Milwaukee |
$114,800 |
10.6% |
2.40 |
1.33 |
1.50 |
| Tucson |
$181,000 |
7.5% |
2.18 |
1.16 |
1.19 |
| Portland |
$424,700 |
0.9% |
1.47 |
0.73 |
0.48 |
| Oklahoma City |
$126,400 |
2.3% |
3.51 |
2.12 |
1.71 |
| Omaha |
$167,900 |
7.6% |
1.92 |
1.53 |
1.15 |
| Albuquerque |
$194,300 |
6.2% |
1.76 |
1.07 |
1.06 |
| Fresno |
$231,700 |
7.1% |
2.40 |
1.07 |
0.97 |
| Sacramento |
$318,900 |
7.3% |
1.97 |
0.97 |
0.65 |
| Mesa |
$240,200 |
7.8% |
2.09 |
1.19 |
0.96 |
[i] The Zillow Home Value Index (ZHVI) is the median estimated home value for a given geographic area on a given day and includes the value of all single-family residences, condominiums and cooperatives, regardless of whether they sold within a given period. It is expressed in dollars, and seasonally adjusted.

