January 2025 S&P Case-Shiller Price Index: Home prices accelerate, again.
In January, strong stock portfolios, and in the case of repeat buyers, record high home equity from the last sale, enable enough buyers to keep the pressure on.

In January, strong stock portfolios, and in the case of repeat buyers, record high home equity from the last sale, enable enough buyers to keep the pressure on.
What happened:
The seasonally adjusted national S&P Corelogic Case-Shiller Index (C-S) accelerated again in January despite high mortgage rates and rising inventory nationally, a strong indication that there is enough demand to keep the pressure on. In contrast, according to the Zillow Home Value Index (ZHVI), January appreciation was much softer at 0.1% when seasonally adjusted. Released one month earlier, February’s ZHVI appreciation continued to decelerate as affordability remained a significant challenge for most buyers.
Why it matters:
Without mortgage rate or home price relief, housing affordability is now a binding barrier to most potential home buyers, especially for those buying for the first-time and unable to capitalize on these continually appreciating home prices. Such appreciation is evidence that not all buyers are held back, however. Strong stock portfolios, and in the case of repeat buyers, record high home equity from the last sale, enable enough buyers to keep the pressure on. These trends may abate with the loss of value in U.S. stock portfolios over the end of February and early March.
The ZHVI and C-S began demonstrating a difference in the strength of home value appreciation midway through 2024 – another year of volatile interest rates without much pricing relief nationally. In both cases, monthly appreciation accelerated into the end of 2024, however, Zillow observed a more moderate appreciation overall. This trend began to decelerate in January 2025, and subsequent months have seen even greater slowdowns.
The cause of disagreement is likely built into the major methodological differences of the two indices: the C-S needs a repeat sales to include in its construction, likely under-capturing newer neighborhoods whose homes have yet to sell twice. By leveraging repeated Zestimates across the U.S. (using the same neural network algorithm for each subsequent month), the Zillow Home Value Index is better able to capture the influence of high rates of new construction since 2019.
A second primary difference is in their purpose. The Zillow Home Value Index captures the dynamics of the middle third of the market to focus on the experience of a customer shopping for homes. The C-S is value weighted across the whole distribution to follow the value of housing taken as an investment portfolio.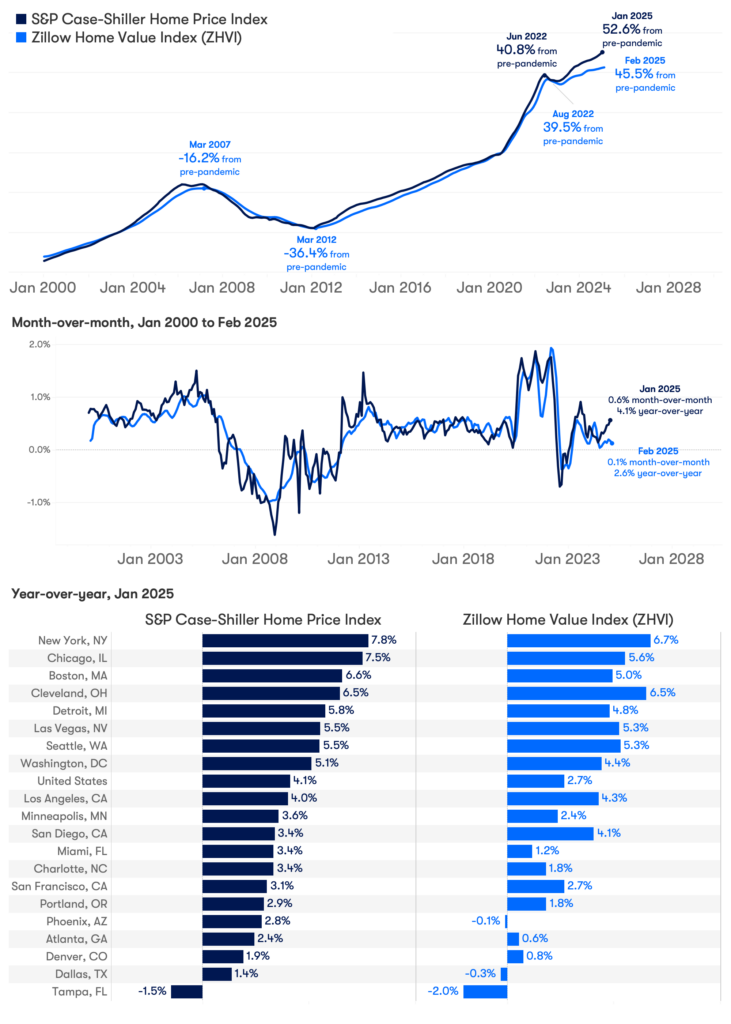
