January Existing Home Sales: An Ominous Start to 2018
Sales were down 4.8 percent annually, the largest year-over-year drop since November 2015. The median seasonally adjusted price of existing homes sold in January surged to a new all-time record, increasing by 1.8 percent to $255,500, up 5.7 percent over the year.
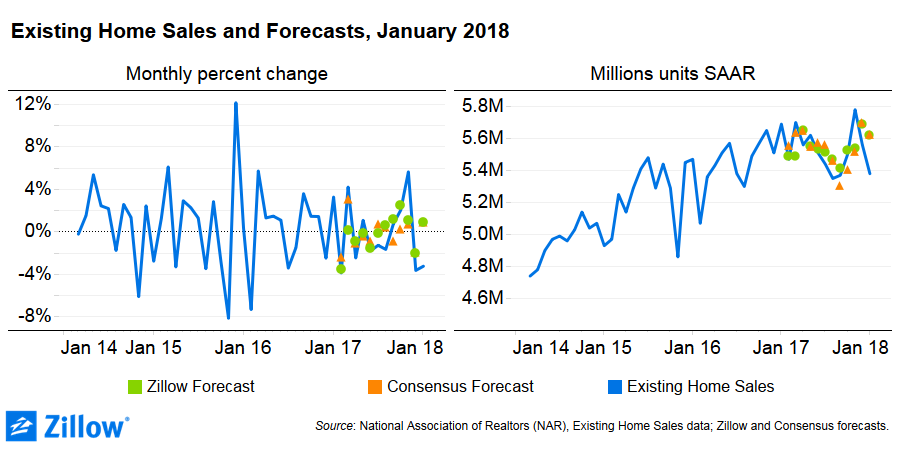
- January existing home sales fell 3.2 percent from December to 5.38 million units at a seasonally adjusted annual rate (SAAR), their largest monthly drop in two years.
- The decline was driven by a sharp drop in single-family home sales in the West – arguably the country’s most supply-constrained region – and in the Midwest.
- The median seasonally adjusted price of existing homes sold in January surged to a new all-time record, increasing by 1.8 percent to $255,500, up 5.7 percent year-over-year.
- Inventory eased, increasing 2.3 percent from December to 1.72 million units (SAAR) but remained down 9.5 percent from a year ago.
Existing home sales declined for a second consecutive month in January, falling 3.2 percent from December to 5.38 million units at a seasonally adjusted annual rate (SAAR) according to the National Association of Realtors (NAR). December sales were revised downward from an initially reported 5.57 million units to 5.56 million units (both SAAR). Sales were down 4.8 percent annually, the largest year-over-year drop since November 2015.
The decline was driven by drops in single-family home sales in the West and Midwest. Single-family home sales in the West fell 5.7 percent to 1 million units (SAAR) and single-family home sales in Midwest fell by 6.4 percent to 1.17 million units (SAAR). Condo/coop sales in both regions were flat over the month. Existing single-family home sales also fell – although less sharply – in the South (down 2 percent) and Northeast (down 1.6 percent). Year-over-year, single-family existing home sales are down 9.1 percent in the West compared to 7.6 percent in the Northeast, 4.1 percent in the Midwest and 2 percent in the South.
Looking over the past six years since the start of the housing recovery in February 2012, single-family existing home sales in the West are down 4.8 percent while they are up 27.7 percent in the South, up 24.5 percent in the Northeast and up 29.6 percent in the Midwest.
The number of existing homes on the market increased 2.3 percent to 1.72 million units (SAAR), the largest percent increase since September 2016. That means about 39,500 more homes were on the market in January than in December. However, December inventory was revised downward by about 2,000 units to 1.68 million units (SAAR), and that revision accounts for about 5 percent of the month-over-month increase in on-market inventory. Inventory is still down 9.5 percent from a year earlier and – according to Zillow data – most of the inventory gains have been among homes priced in the upper third of the market, not entry-level homes.
The median seasonally adjusted price of existing homes sold in January surged to a new all-time record, increasing by 1.8 percent to $255,500, up 5.7 percent over the year. It was the largest month-over-month percent increase in the median price of existing homes sold since February 2015. Regionally, the month-over-month price increase was strongest in the Midwest (up 4.1 percent) and slowest in the West (up 0.8 percent). Over the past year, the West has seen the strongest price gains, and the median price of homes sold in the West is now $380,800 – almost $100,000 more than the median price of existing homes sold in the next-priciest region, the Northeast ($281,300) and almost double the median price of existing homes sold in the Midwest ($207,000).
