Uncategorized
January Home Sales Forecast: Seasonal Adjustment Disorder
Tight inventory will continue to weigh on existing home sales, according to our January home sales forecast, while new home sales should rebound from a slow December. Looking farther ahead, shifting behaviors among home sellers, buyers and builders make it trickier to read definitive trends in seasonally-adjusted home sales data.
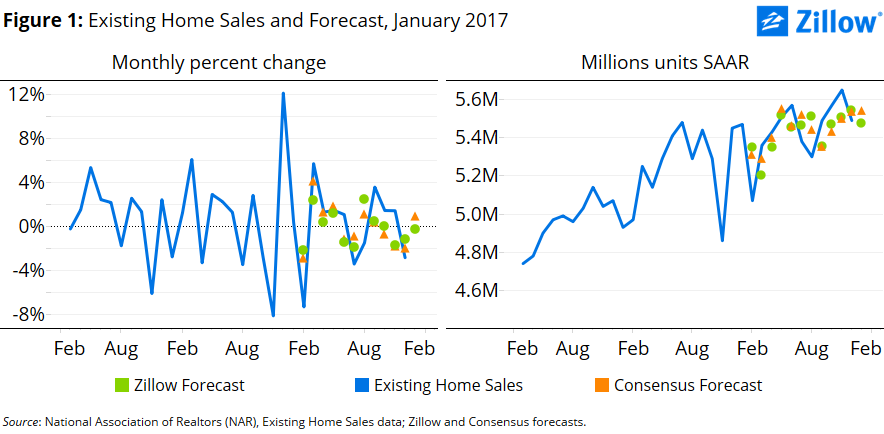
- Zillow expects existing home sales to fall 0.3 percent in January from December, to 5.47 million units at a seasonally adjusted annual rate (SAAR).
- New home sales should rise 2.4 percent from December, to 549,000 units (SAAR).
- Shifting patterns mean that December and January home sales have been less seasonal than historically has been the case.
Tight inventory will continue to weigh on existing home sales, according to our January home sales forecast, while new home sales should rebound from a slow December. Looking farther ahead, shifting behaviors among home sellers, buyers and builders make it trickier to read definitive trends in seasonally-adjusted home sales data.
We expect existing home sales as reported by the National Association of Realtors to total 5.47 million units at a seasonally adjusted annual rate (SAAR) in January, down 0.3 percent from December 2016 and essentially unchanged from January 2016 (figure 1). Exceptionally tight for-sale inventory – which touched historic lows when scaled by population last month – continues to weigh on existing home sales. Mortgage rates retreated from their December heights for much of January, likely mitigating some of the inventory-related headwinds.
We expect new home sales, reported by the Census Bureau, to total 549,000 in January, up 2.4 percent from a dismal December that could be at least partly blamed on unusually harsh winter weather across much of the country, and up 4.4 percent from January 2016 (figure 2).
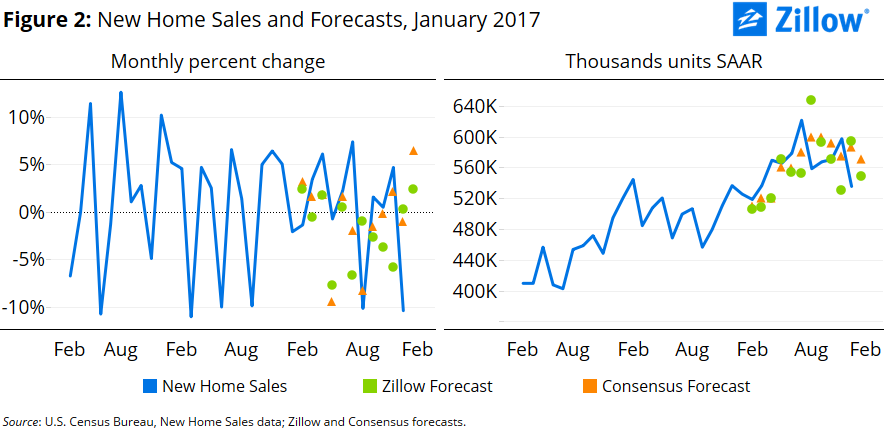
Over the longer horizon, we expect existing home sales to rise 0.5 percent to 5.50 million units (SAAR) for the year ending January 2018, and new home sales to rise 10.1 percent to 579,000 units (SAAR) over the same period.
Seasonally Affected
Our model is designed to forecast the seasonally adjusted number of home sales. However, as seasonal patterns shift, the seasonally adjusted number of home sales could fail to accurately capture housing market dynamics.
Seasonal adjustment typically estimates an average month-over-month change in the unadjusted data over a number of years, then adds or subtracts this “seasonal factor” to the raw series.[1] So the seasonal factors applied to January 2017 data will average December to January changes over the period 2010 through 2016.
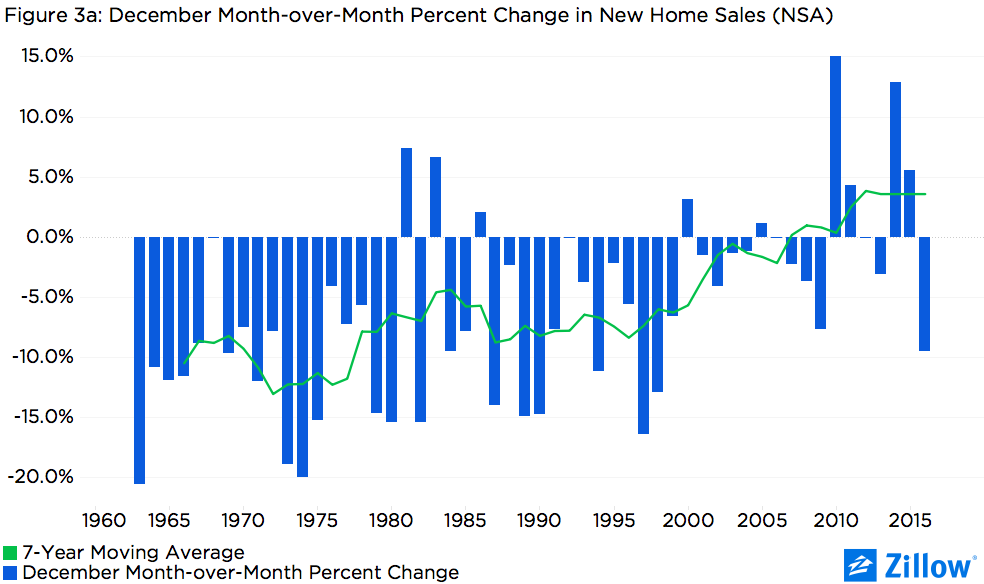
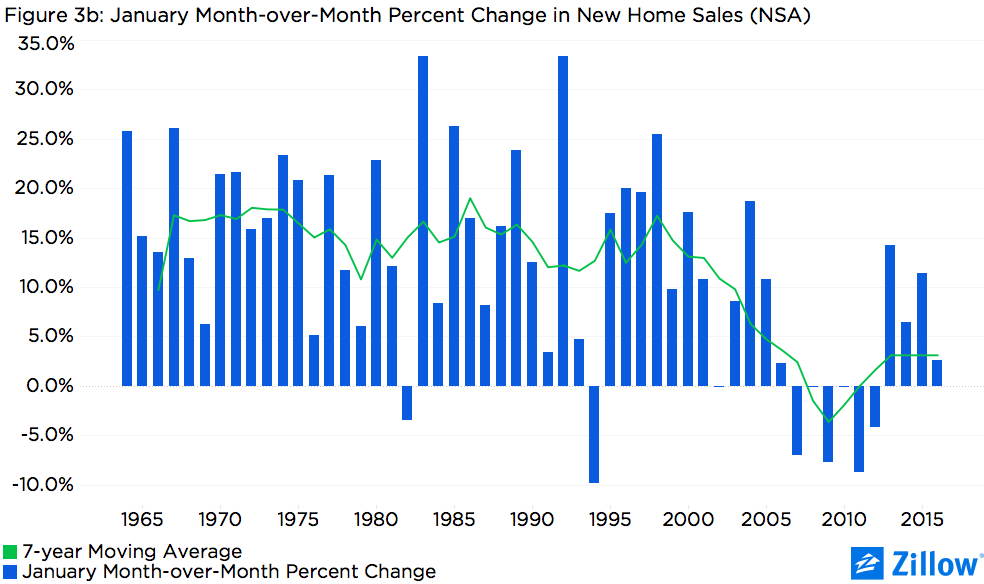
But some evidence suggests that as seasonal patterns have shifted over time, these seasonal factors may fail to capture the full set of dynamics in housing markets. Figures 3a and 3b show the month-over-month percent change in non-seasonally adjusted new home sales for December and January, and the seven-year moving average used in seasonal adjustment over the past five decades. The upward trend in the December seasonal factor and the downward trend in the January seasonal factor show that in recent years new home sales have seen less of a seasonal drop in December and, as a result, less of a monthly jump in January.
There are a number of possible explanations for these trends:
- Geographic shifts: In the late 1980s, about 40 percent of new home starts were in the Southern United States; today that share is upward of 50 percent. As new construction activity has shifted toward parts of the country with warmer climates, winter stoppages/slowdowns have become less prominent in aggregate home sales data.
- Builder size: As larger, publicly-traded builders have captured a larger share of the market over the past four decades, construction activity has benefitted from greater access to capital and economies of scale in land, materials and labor.
- Tight inventory: Finally, tight for-sale inventory has resulted in home shoppers staying on the market longer and seizing opportunities as they arise. While home shoppers might start to think about buying a home along the same seasonal patterns always have, they stay on the market longer. Additionally, some buyers may attempt to get a head start by starting their search earlier in the year.
Regardless of the precise reason, recent Decembers have seen larger month-over-month jumps and recent Januarys have seen smaller month-over-month drops in non-seasonally adjusted home sales than has historically been the case.
[1] Both existing and new home sales are seasonally adjusted using a standard technique, developed by the U.S. Census Bureau, which averages month-over-month changes for a given month over a window of seven years. For instance, the seasonal factor associated with December 2013 will average the percent change from November to December from 2010 through 2016. The seasonal factors for the most recent year for which a complete series is available – including the three future years – are applied to the most recent years for which leading data are not yet available. Seasonal factors for the most recent years are subsequently revised as new data become available.

