July Home Sales: New and Existing Sales Expected to Reverse Some of June’s Unexpected Change

Note: We will soon begin publishing our monthly forecasts of existing and new home sales for the next month the day that the prior month’s data are published. We will also begin including longer-term forecasts, including 2-month, 3-month, and 6-month forecasts.
Sales of existing and newly built homes are expected to move in opposite directions in July, partially offsetting unexpectedly strong June changes, according to a Zillow forecast.
Zillow expects July existing home sales to fall about 2.1 percent to a seasonally adjusted annual rate (SAAR) of 5.38 million units, down from 5.49 million units (SAAR) in June. We expect July new home sales data to show a monthly increase of about 4.2 percent, to 502,000 units (SAAR) from 482,000 units in June.[i]
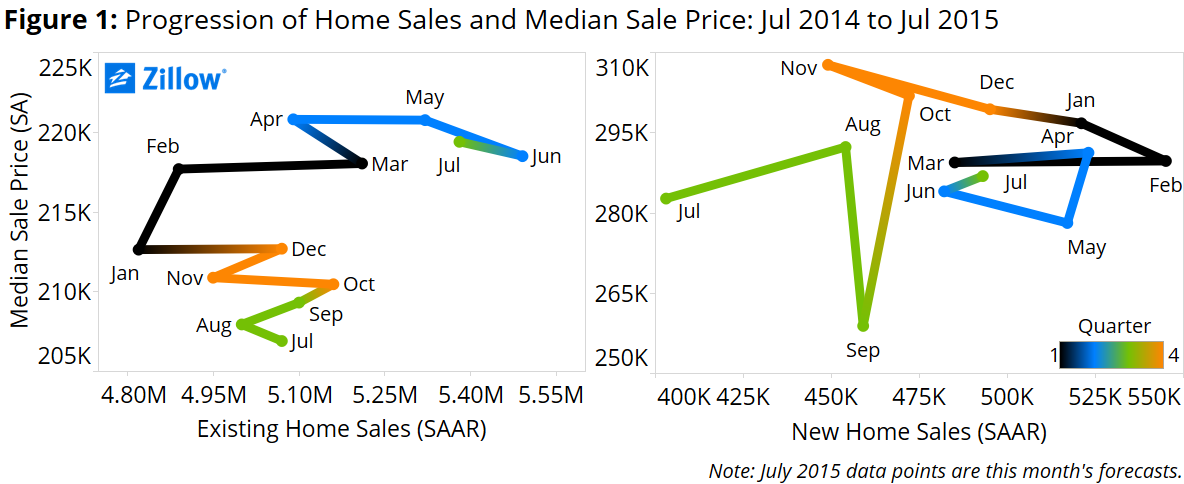
Zillow expects the median price of a new home to rise to $289,300 (seasonally adjusted) in July, up 1.8% from $284,000 in June, and the median existing home price to increase slightly to $219,400 (SA), up 6.1 percent year-over-year. [ii]
Through the end of the second quarter, 2.5 million existing homes had been sold nationwide, up 7.7 percent from the same period last year. As sales have grown, prices have also risen, up 6.1 percent in June from a year earlier, to $219,400 (SA) from $205,200. But June was also the first month in which median existing home prices fell from the prior month in almost two years. Monthly price declines occurred every census region except the west.
New home sales ended the first half of 2015 on a weak note, falling 6.7 percent from May to June. But looking longer-term, new home sales have risen substantially, with the 273,000 year-to-date sales up 20 percent through the first two quarters of the year compared to the first half of 2014. More importantly, the median price of new homes sold has steadily declined since November, giving younger buyers a better shot at a new home. The median price of a typical new home in June was $284,000 (SA), down from $289,300 a year ago (figure 1).
 A key unknown for the next six months is how home sales will respond to the looming increase in interest rates by the Federal Reserve. The Fed is expected to increase its target for short-term interest rates by the end of 2015, which should in turn be reflected in higher mortgage interest rates, although the relationship is not necessarily one-to-one. In last month’s forecast, we noted that a 95 basis point jump in the 30-year conventional mortgage rate in July 2013 was associated with a decline of 12 percent and 19 percent in new and existing homes sales, respectively, over the following few months.
But sales activity is just part of the story: Prices also matter. A recent paper by the San Francisco Fed found that the impact of a 1 percentage point hike in the policy rate is gradual but notable – after 4 years, mortgage lending declined by 3 percent, and home prices fell by 4 percent. So an increase in mortgage rates in coming months will likely hurt home sales, but the slower home price growth that will likely accompany it should be a welcome sight for budget-conscious buyers.
By some assessments, existing home sales have been suffering from a vicious feedback loop: Low inventory leads to high prices, which discourages owners from selling to buy a new home, leading to low inventory, and on and on. But is low inventory just a matter of perception? The supply of homes for sale remains low compared to the mid-2000s boom years, but is at levels observed in 2002 (the early stages of the housing bubble) and the highest it’s been since October 2014. This is a positive sign for inventory in the short-term. But persistently high negative equity is a longer-term problem, preventing millions of mortgaged homeowners from listing their homes for sale and buying a new home, particularly those at the bottom end of the market stuck in homes likely to be attractive to first-time buyers.
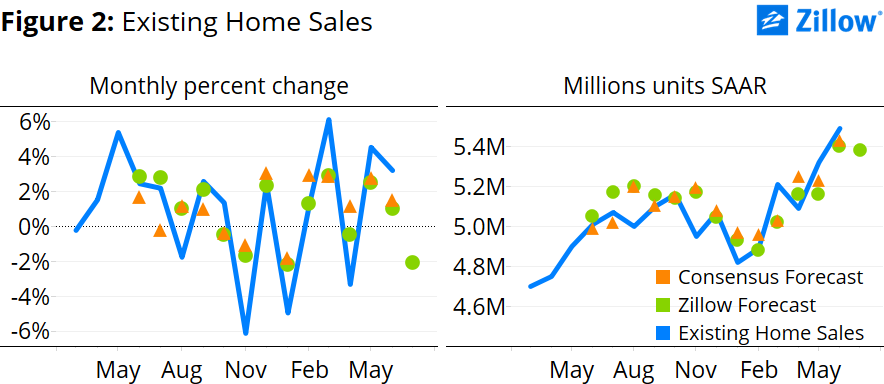
As housing demand picks up along with an improving jobs market and stronger wages, pending home sales have increased in almost every month this year – except June – and are up 8 percent year-over-year. Higher pending sales typically indicate more closed sales over the next few months as the closing process runs its course. With higher than expected sales in June, coupled with a decline in pending sales, this likely means that more homes finished the closing process last month than entered into it. Thus, lower pending sales in June is likely to lead to a drop-off in existing sales in July (figure 2).
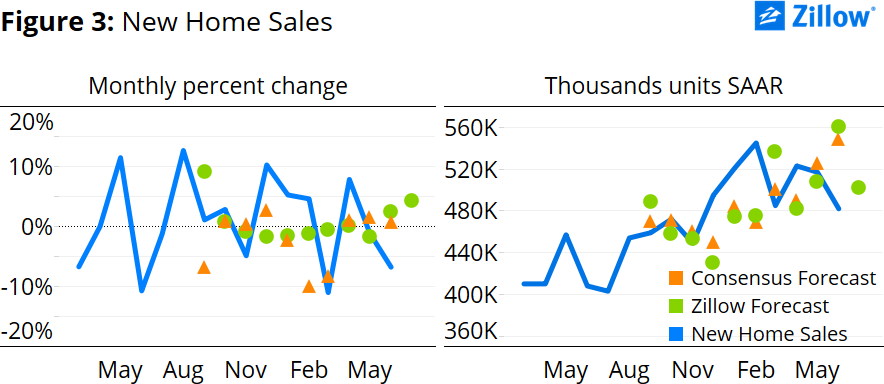
The combined number of new homes completed and ready for sale in June was up 8.5 percent from the same time last year, providing plenty of potential for robust summer sales (figure 3) as it typically takes about four months for a new home to sell once it is completed.[i] But longer-term inventory of new homes will likely remain low compared to historical standards, as June construction starts were 33 percent below what they were in the mid-1990’s. If construction starts continue to grow in 2015 at the current, average, year-over-year rate of about 9 percent,[ii] home construction levels won’t reach their 1995 level until 2020, and wouldn’t get back to their pre-crisis levels until 2027.
 Forecast
Our home sales forecast estimates an error correction model that takes into account the estimated long-run relationship among housing market fundamentals and monthly changes.
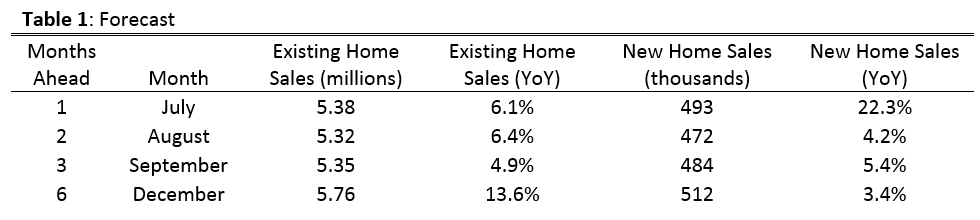
According to this model, existing home sales are above the estimated long-run relationship in the market, while new home sales are below the estimated long-run relationship in the market. The error correction mechanism alone suggests a 1 percent decrease in existing sales activity and a 6 percent increase in new home sales activity. But monthly changes in other housing market data – including pending home sales, inventory, new home construction, median sales prices and mortgage expenses – should boost the effect of the correction for existing home sales and dampen the correction effect for new home sales in July (table 1).
Looking further out (1, 2, 3, and 6 months ahead), our model suggests both new and existing home sales are likely to fall slightly compared to July at summer’s end and into the fall, before picking up again in December. Both existing and new home sales are expected to be higher on a yearly basis each month as we move further into the year.
[i] According to the U.S. Census Bureau.
[ii] The current growth rate of new home construction of is calculated as the average monthly year-over-year growth rate over the past 12 months.
[i] The National Association of Realtors (NAR) will release July existing home sales data on August 20, and the U.S. Census Bureau will release July new home sales data on August 25.
[ii] The forecast of the median sale price is determined within the error correction model, and helps us get a sense of where the housing market will be this month in terms of a supply and demand framework.
