Buyers Gaining Time and Options as Housing Market Rebalances (July Market Report)
Competition is easing as inventory accumulates, leading the market back toward ‘normal’
Competition is easing as inventory accumulates, leading the market back toward ‘normal’
After two years of unprecedented growth, national home values fell slightly month-over-month for the first time since 2012, the year home values hit a trough after the housing bubble and bust of the aughts. While July’s housing market data update is big news, and could get first-time buyers’ hopes up, the future is unlikely to bring meaningful improvement to housing affordability.
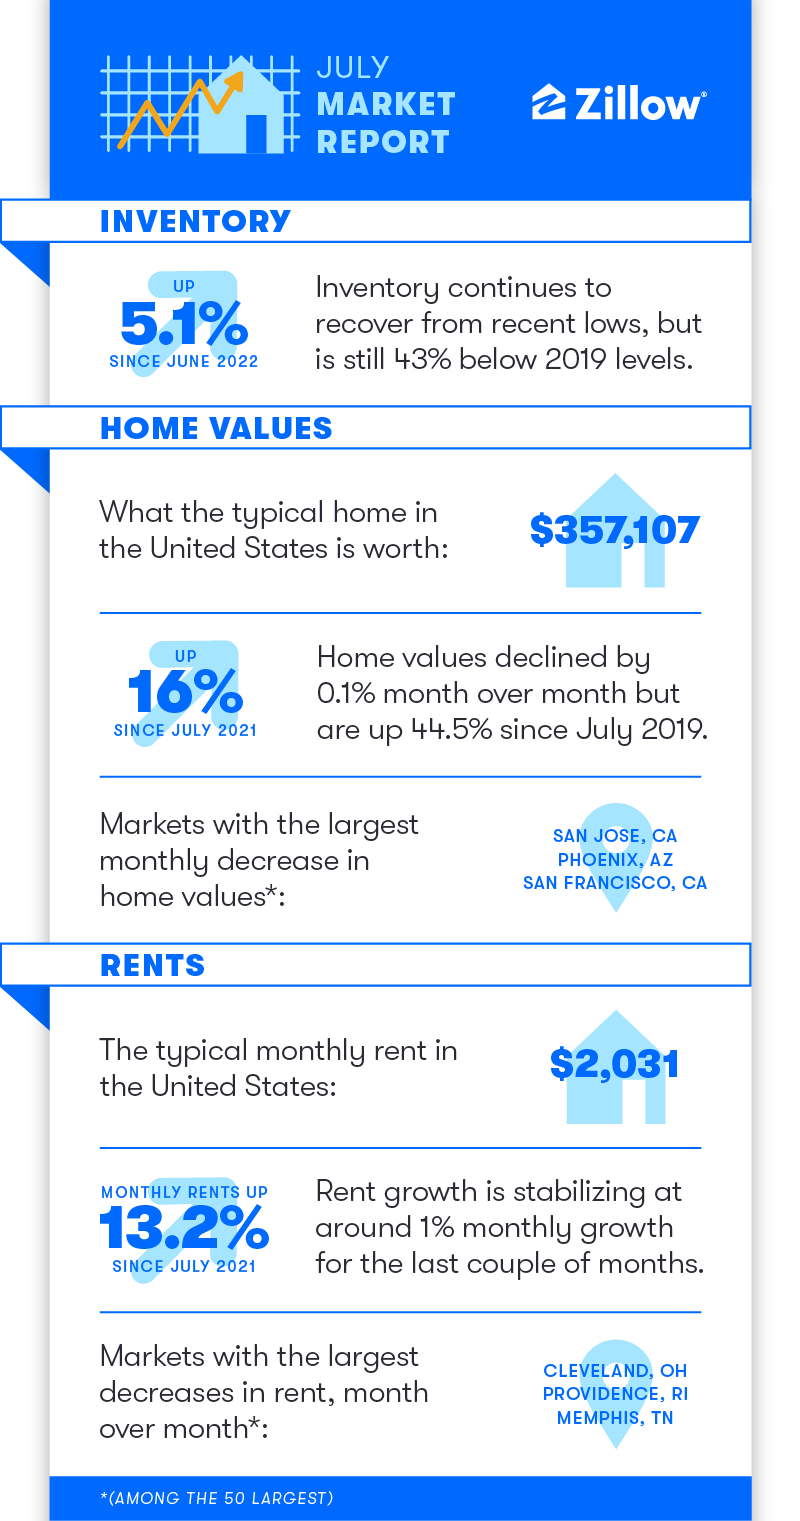
The typical U.S. home value now stands at $357,107 after declining by 0.1% ($366) month over month in July, as measured by the raw Zillow Home Value Index (ZHVI). A more responsive, but also more volatile flavor of Zillow’s headline price index – monthly growth in the raw ZHVI – has relaxed since reaching a recent peak in April of 1.9% (a rate that would annualize to a whopping 25.1%), slowing to 1.2% growth (15.3% anualized) in May and 0.8% growth (9.7% annualized) in June.
Home values measured by raw ZHVI fell from June to July in 30 of the 50 largest metro areas, an increase from 13 metros the previous month. The largest monthly home value declines were in San Jose (-4.5%) and San Francisco (-2.8%, that’s -28.7% anualized) — the nation’s most expensive major markets — followed by Phoenix (-2.8%) and Austin (-2.7%), which saw the most extreme growth over the pandemic. Values increased the most from June in Miami (1.5%, a still aggressive 19% annualized rate), Richmond (1%, 12.1% annualized) and Memphis (0.9%, 11.2% annualized), although monthly growth is decelerating in these markets as well.
While the recent decline in prices is a notable development, the housing market is still far from a return to “normal” conditions. The current slowdown is prompted by the collision of extreme price growth during the early- and mid-pandemic with the sudden increase in mortgage rates since December – a combination that swiftly weakened would-be homebuyers’ ability to afford or qualify to purchase their next house. The nation’s typical home value is still up 16% year over year and 44.5% since July 2019, despite softer pricing in more recent months. Incorporate higher mortgage rates, and the typical mortgage payment has risen by more than 60% in just one year. While high prices plus higher mortgage rates have pushed some buyers from the market for now, those shoppers who are able to proceed suddenly face a much less competitive market, offering them more time to conduct their search and more options to consider.
Cooling competition among buyers has resulted in homes spending more time on the market before selling. While the typical home that goes under contract still does so in a historically short amount of time, this market velocity has slowed considerably from the rapid pace set earlier this year. Homes went pending in a median of 10 days in July – two days slower than the median pace in June. Homes lingering on the market continue to push for-sale inventory up, even as the rate of new homes entering the market slows. The number of active for-sale listings during the month increased by 5.1% in July from June. The increase was the fifth consecutive monthly uptick, with each month successively stronger (for the most part) than seasonally typical for the spring into summer shopping season. July’s monthly inventory lift at 5.1%, for example, dwarfs the 1% average for July during 2018 and 2019.
While the pool of inventory is increasing quickly, a more substantial increase in for-sale listings has been hindered by slowing new construction – home starts fell 9.6% in July from June – and general hesitation from would-be sellers. New for-sale listings of existing homes fell 13.6% month over month in July. A far bigger drop than is seasonally typical, the rate of new listings hitting the market has been slower than pre-pandemic norms since the beginning of the year. In July for example, 16.6% fewer new listings were put on the market than the average July from 2018 and 2019. Would-be sellers remain mindful of their ability (or lack thereof) to purchase their next home and rising mortgage rates have left many homeowners “locked in” to their existing interest rate. A massive wave of homeowners refinanced during the pandemic, either to benefit from historically low mortgage rates directly or to harvest their home’s equity with a cash out refinance. Cheap financing offered an opportunity for many to remodel their property to better meet their changing needs rather than move on. As a result, the recent increases in for-sale inventory are more reflective of reduced competition than any real increase in the overall options that buyers will have over their multi-month shopping experience. What’s more, this lack of new listing activity should continue to buoy home prices against persistent or deeper declines.
Active sellers and their agents are suddenly having to adjust to the changing market conditions. The share of for-sale listings with a price cut jumped to 18.6% in July – up 7.5 percentage points from July 2021 and more than double the share of listings that saw a price decrease in April. While the overall share of listings seeing a price reduction isn’t abnormal – in the years preceding the pandemic it wasn’t uncommon for one in five listings to adjust their price during the month to help the property sell in reasonable time – the sharp increase in this activity is a loud indicator of how sellers are shifting their pricing strategies to account for quickly changing market conditions, even if recent price reductions haven’t materialized into true bargains for home shoppers yet.
The rental market remains in a period of relative calm, continuing a trend that’s formed in recent months. The nation’s typical monthly rent in July was $2,031, up 0.6% from June and up 13.7% from a year prior. After a rapid run-up that peaked in February, and seeing higher volatility throughout the pandemic’s first year and a half, rent growth has moderated in recent months. That said, although growth is decelerating, the annual growth rate is still more than three times that of July 2019.
Among major metros, the most significant slowdowns in monthly rent growth since July of last year occurred in Las Vegas (from 3.6% to -0.2%), Phoenix (3.5% to -0.3%), Tampa (3.9% to 0.3%), and Austin (3.8% to 0.7%).
The housing market is ultimately correcting for extreme pressure during the pandemic. However, challenges to new supply and strong long-run housing demand driven by massive younger generations aging into first-time home buying suggests that, as the slowdown continues to progress and competition and price pressures ease, enough buyers will be ready to move forward and turn the market back toward (hopefully healthier) positive price growth.
