Uncategorized
June Existing Home Sales: Low Inventory Pushes Sales Down, Prices Up
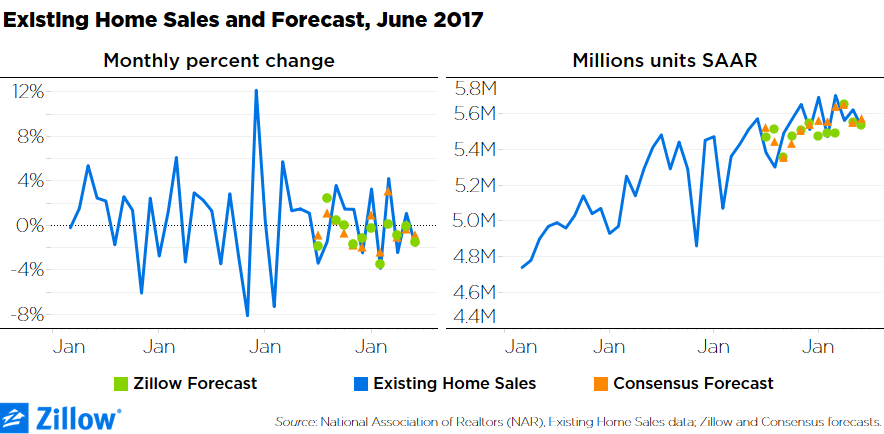
June existing home sales fell in line with expectations, declining 1.8 percent from May to 5.52 million units at a seasonally adjusted annual rate (SAAR), according to the National Association of Realtors (NAR).
- June existing home sales fell in line with expectations, declining 1.8 percent to 5.52 million units (SAAR).
- The number of homes on the market fell 0.25 percent in June to 1.84 million units (SAAR), the 25th consecutive month of declining inventory.
- The median price of existing homes sold in June rose 1.1 percent from June to $245,200, a new all-time record.
June existing home sales fell in line with expectations, declining 1.8 percent from May to 5.52 million units at a seasonally adjusted annual rate (SAAR), according to the National Association of Realtors.
Tight inventory, which fell year-over-year for the 25th consecutive month, continued to both weigh on sales numbers and push median sales prices up in June. The median seasonally-adjusted price of existing homes sold in June was $245,200, a new all-time record and up 1.1 percent from May and 6.6 percent from last June.
Sales of existing homes have largely stagnated since last fall – rising one month and falling the next and remaining in a relatively narrow 200,000-unit range, on average. Over the year, existing home sales were up 0.7 percent in June, the slowest annual growth pace since September 2016.
The South was the only region to experience accelerating sales over the past year in June. But after a sharp jump in the first quarter of 2017, existing home sales in the South have since fallen back to 2016 levels. Existing home sales have been flat in the West thus far in 2017, on average, and have declined somewhat in the Northeast and Midwest.
For-sale inventory – the number of homes (single-family homes and condos/coops) available to buy – fell 0.25 percent from May to 1.84 million units (SAAR), and was down 7.2 percent over the year. The number of homes on the market has declined year-over-year in every month since June 2015. Compared to May 2015, there are 304,000 (14 percent) fewer homes on the market nationwide. The inventory decline is sharper for single-family homes, down 15.1 percent from May 2015. Since June 1982 (the start of this data series) there have only been 15 months total in which fewer homes have been on the market: A string of several months from mid-1994 to mid-1995, and in March 2000. Currently, there are a similar number of single-family homes on the market as in 1994 – but there are 63.4 million (24 percent) more people in the United States.
Price growth in June was driven by gains in the West (up 1 percent from May) and the Midwest (up 1.3 percent), while price growth was substantially slower in the South and Northeast (0.4 percent each). The median sale price is 8.3 percent above pre-recession peaks in the Midwest, up 7 percent in the South, up 3.3 percent in the West. Prices of existing homes remain 6.3 percent below prior peaks in the Northeast. The gap in median sales prices between the West and the Northeast – the country’s two most expensive regions – has never been wider: The median price of homes sold in the West is now 33 percent more expensive than homes sold in the Northeast, compared to a historic average around 24 percent.
Related:

