Key Takeaways from the June Existing Home Sales Report

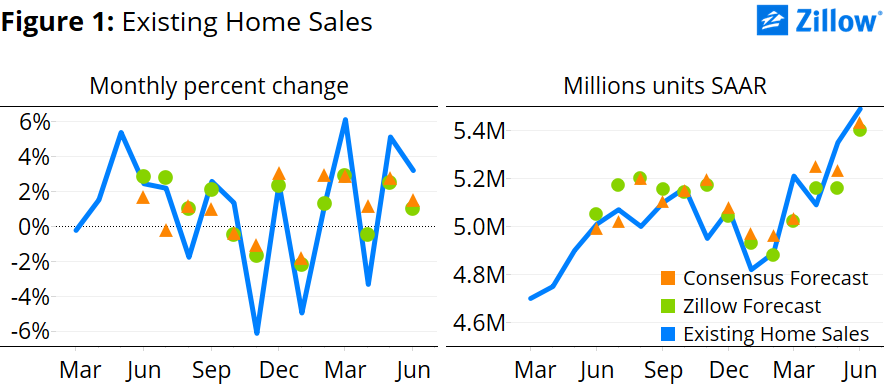
Existing home sales started the summer home shopping season on a high note, after a robust end to spring. After rising 4.5 percent in May from April, existing sales rose again in June, up an unexpectedly strong 3.2 percent from May to a seasonally adjusted annual rate (SAAR) of 5.49 million units, according to the National Association of Realtors (figure 1).
Sales of existing homes are at their highest level since November 2009, when federal homebuyer tax credits helped boost home sales. Prior to the bubble, the last time sales were at this level without federal help was July 2002 (5.41 million units SAAR).
Existing home sales increased in each of the four major regions. The Northeast and Midwest led the way, with sales in those areas up 4.3 and 4.7 percent from May, respectively. The South and West weren’t far behind, experiencing sales increases of 2.3 percent and 2.5 percent from May, respectively. The Midwest and Northeast regions also lead in year-over-year sales gains, both up 13 percent from June last year. But even with strong recent activity, the Northeast is the only region still lagging behind January 1999 levels, the earliest recording for existing home sales.
Strong demand, driven largely by an improving job market and expectations of future mortgage rate increases, coupled with continued tight inventory, helped propel annual median sales price gains up for the 40th consecutive month. The national median price of an existing home was $236,400 in June, up 6.5 percent from a year ago. This annual growth rate is comparable to the 7 percent year-over-year average from 2000 through 2004, but below the 17 percent peak rate experienced at the height of the bubble in October 2005 and the recovery-era high of 14 percent set in August 2013. The median sales price in June rose year-over-year in each of the four major regions, with the West region up the most at 10 percent.
May and June’s strong sales helped contribute to a lower supply of homes available for sale. The month’s supply of homes on the market fell slightly to 5 months (seasonally adjusted), down from 5.1 months in May, but still slightly above the 4.5 month average during the first half of the 2000’s.
